
Trends in Ozone Adjusted for Weather Conditions
Variations in weather conditions play an important role in determining ozone concentrations. Ozone is more readily formed on warm, sunny days when the air is stagnant. Conversely, ozone production is more limited when it is cloudy, cool, rainy, or windy. EPA uses a statistical model to adjust for the variability in seasonal ozone concentrations due to weather to provide a more accurate assessment of the underlying trend in ozone caused by emissions.
The graph below shows the national trends in the average (black lines), 90th percentile (blue lines) and 98th percentile (red lines) of the May-September daily maximum 8-hour ozone concentrations from 2000 to 2024 at monitoring stations across the contiguous U.S. The dotted lines show the observed trends measured at long-term monitoring sites, while the solid lines show the underlying trends after removing the effects due to weather. The solid lines represent ozone levels anticipated under weather conditions observed in a typical year and serve as a more accurate assessment of the trends in ozone due to changes in precursor emissions.
For example, below average temperatures and above average humidity in the Eastern U.S. in the summer of 2009 contributed to decreased ozone formation, while above average temperatures and below average humidity in the Central and Eastern U.S. in 2012 contributed to increased ozone formation. The statistical model accounts for these effects by adjusting the ozone trend lines upward in 2009 and downward in 2012.
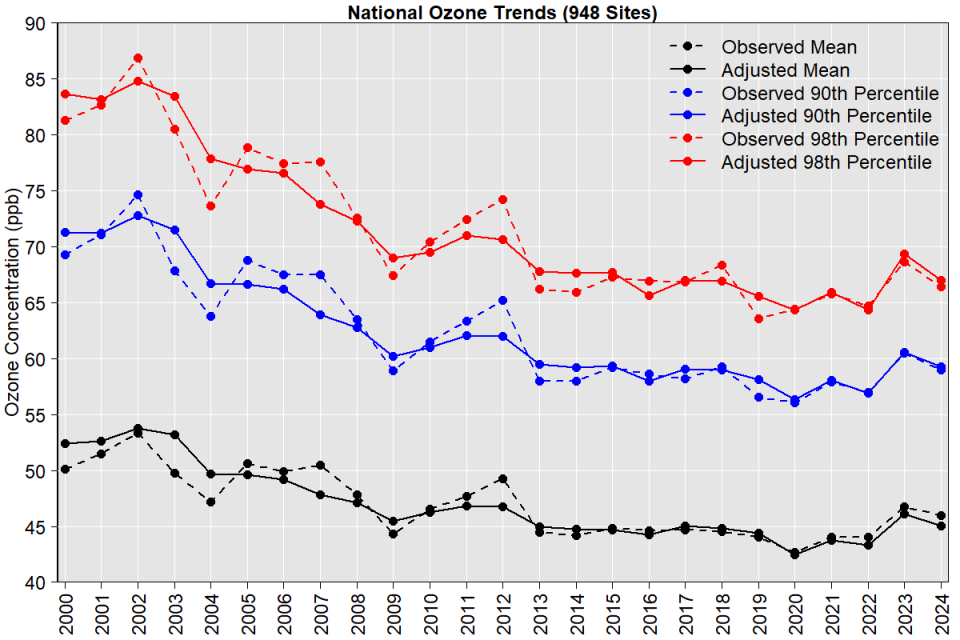
Nationally, after adjusting for the effects of weather, the trend lines show a reduction of about 10 ppb in May-September average concentrations and a reduction of about 20 ppb in 98th percentile values since 2002. The adjusted trends show an overall decrease in ozone levels in 2024 compared to 2023.
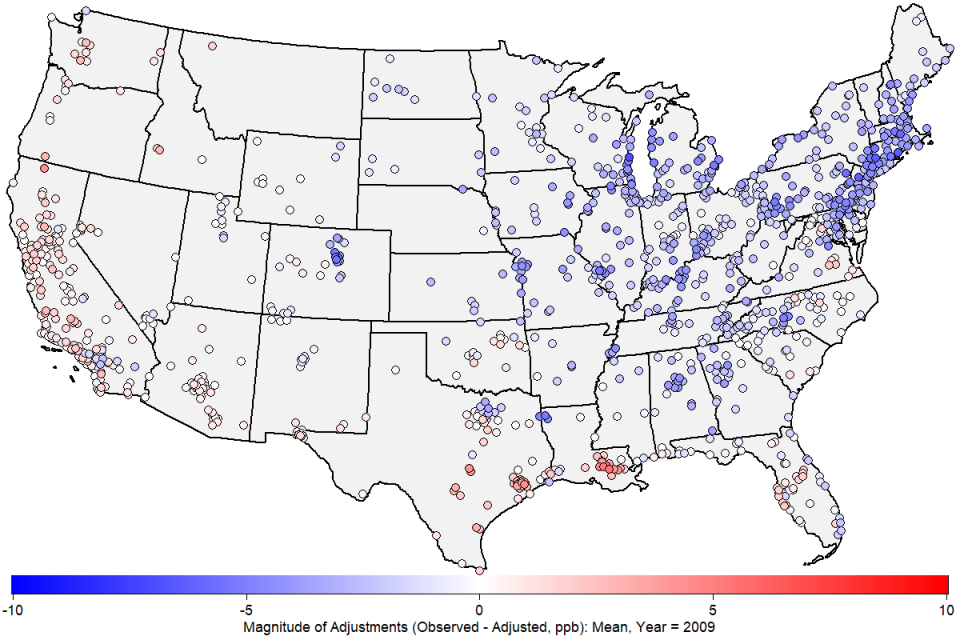
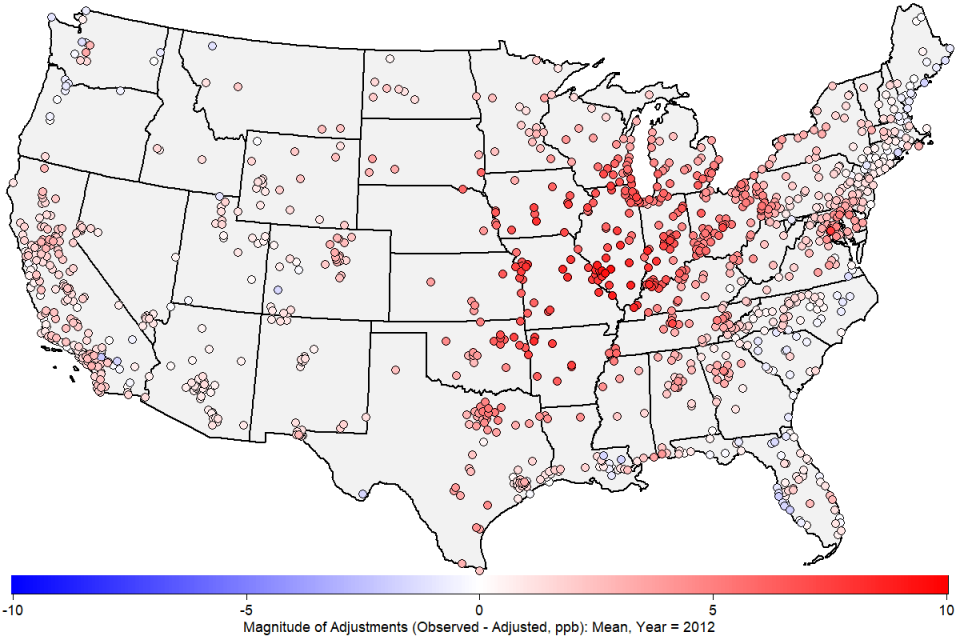
The statistical models used by EPA to determine the adjustments to the trends are fit independently for each ozone monitoring site using local ozone and weather data. However, the results tend to have a strong geographic coherence. As an example, the maps below show the spatial patterns in the adjustments to May-September average ozone levels in 2009 and 2012. Locations where weather conditions were more favorable than usual for ozone formation are shown as red dots, while locations where weather conditions were less favorable than usual for ozone formation are shown as blue dots. Darker colors indicate larger weather-related impacts on ozone formation.
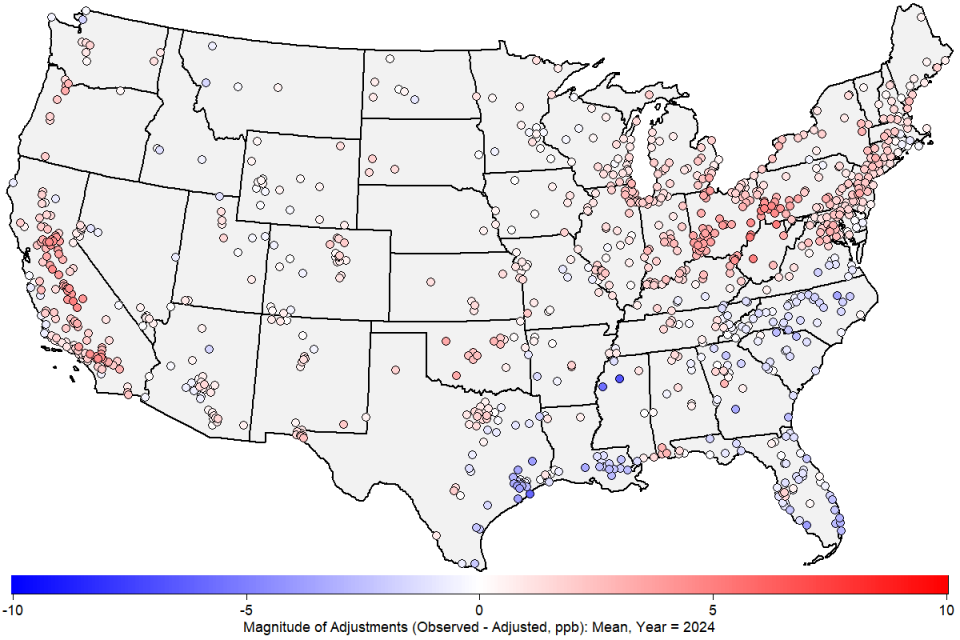
The maps below show the adjustments to the May-September average and 98th percentile ozone levels in 2024, the most recent year in the trend period. Weather conditions in 2024 were near-normal when averaged across the U.S. as a whole, with considerable regional variability.

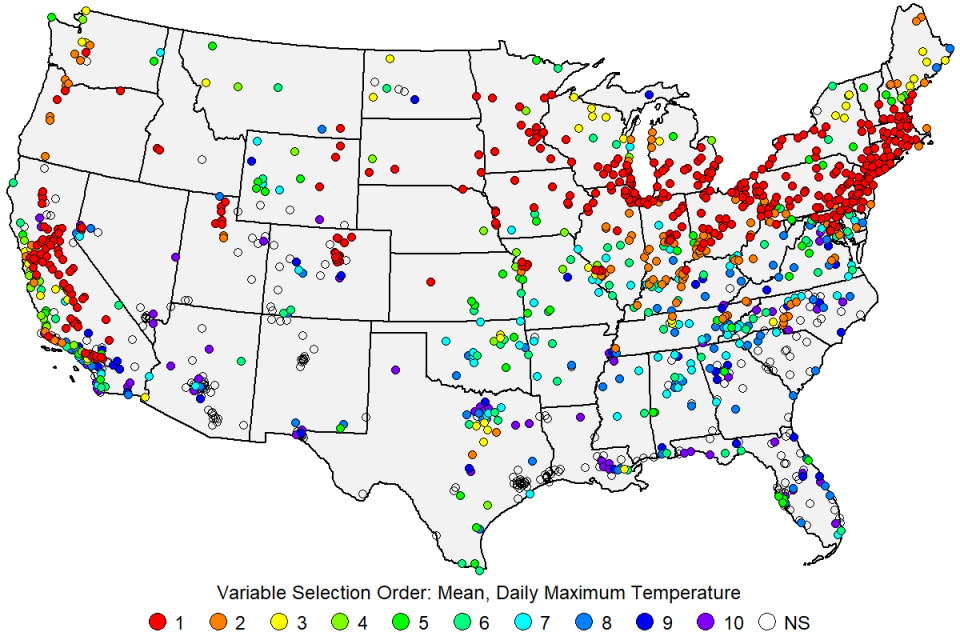
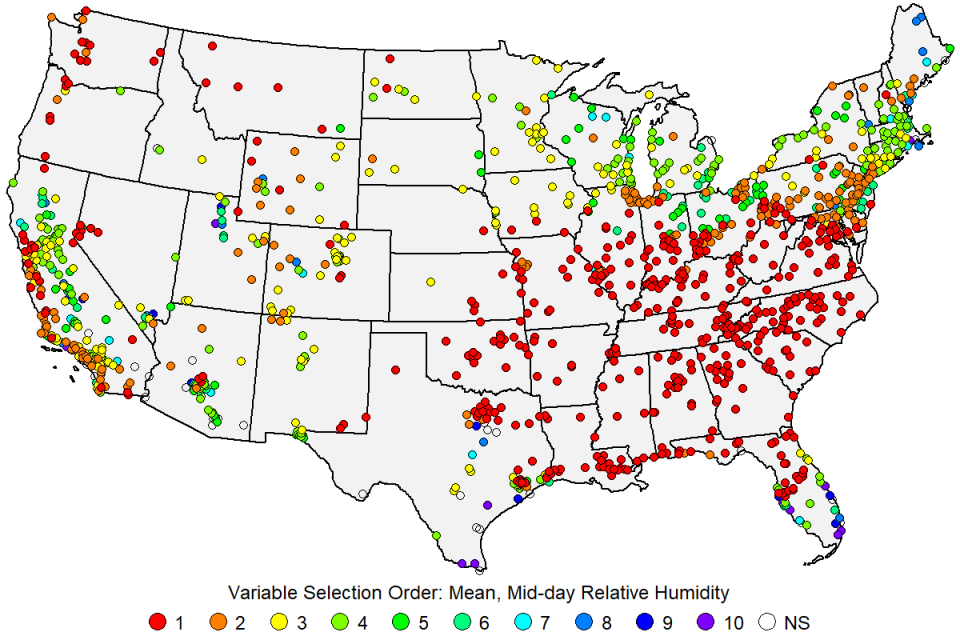
The EPA's statistical model uses a technique called forward selection to choose the weather variables that are most important for ozone formation in each location. Variables are selected iteratively according to greatest improvement in the model fit, up to a maximum of 10 variables. Below are maps showing the selection order (1 = Most Important, 10 = Least Important) for two variables: daily maximum temperature and mid-day relative humidity. Higher temperatures are generally associated with higher ozone levels, while higher relative humidity is generally associated with lower ozone levels.
Additional Resources
Site-level ozone trends, raw and met-adjusted (xlsx)
Ozone trends adjusted for weather, shown by climate region (zip)
Maps of the annual adjustments to the observed ozone trends for 2000 to 2025 (zip)
Graphics showing the selection order for each meterological variable (zip)
Technical Approach - Benjamin Wells et al (2021). Improved Estimation of Trends in U.S. Ozone Concentrations Adjusted for Interannual Variability in Meteorological Conditions. Atmospheric Environment, Volume 248, 1 March 2021, 118234.
Additional Reference - Louise Camalier, William Cox, and Pat Dolwick. The Effects of Meteorology on Ozone in Urban Areas and their use in Assessing Ozone Trends. Atmospheric Environment, Volume 41, Issue 33, October 2007, pages 7127-7137.