U.S. flag

An official website of the United States government

Here’s how you know

Dot gov

Official websites use .gov
A .gov website belongs to an official government organization in the United States.

HTTPS

Secure .gov websites use HTTPS
A lock (LockA locked padlock) or https:// means you’ve safely connected to the .gov website. Share sensitive information only on official, secure websites.

    • Environmental Topics
    • Air
    • Bed Bugs
    • Chemicals, Toxics, and Pesticide
    • Emergency Response
    • Environmental Information by Location
    • Health
    • Land, Waste, and Cleanup
    • Lead
    • Mold
    • Radon
    • Research
    • Science Topics
    • Water Topics
    • A-Z Topic Index
    • Laws & Regulations
    • By Business Sector
    • By Topic
    • Compliance
    • Enforcement
    • Guidance
    • Laws and Executive Orders
    • Regulations
    • Report a Violation
    • Environmental Violations
    • Fraud, Waste or Abuse
    • About EPA
    • Our Mission and What We Do
    • Headquarters Offices
    • Regional Offices
    • Labs and Research Centers
    • Planning, Budget, and Results
    • Organization Chart
    • EPA History

Breadcrumb

  1. Home
  2. Climate Change Adaptation Resource Center (ARC-X)

New York City Adapts To Deal with Projected Increase of Heat Waves
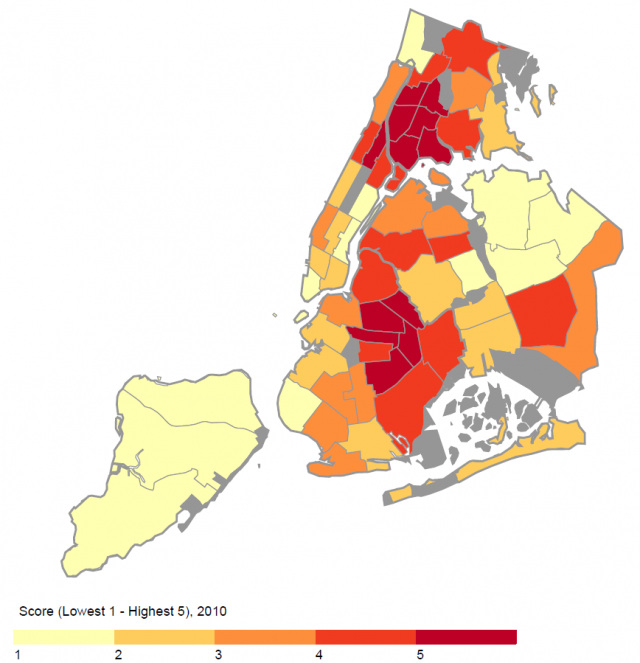
Map showing New York City buroughs ranging from yellow to deep red to indicate heat vulnerability from lowest to highest
New York City Heat Vulnerability Map

Heat waves are one of the leading weather-related causes of death in the United States. According to New York City’s vulnerability assessment, this vulnerability is expected to worsen with changing environmental conditions. 

New York City has taken substantive actions to reduce its current vulnerability (i.e., increasing its resiliency to current conditions) as well as its future vulnerability (i.e., preparing to the projected future environmental conditions).

In order to promote resiliency, NYC is increasing use of cooling centers. Also, NYC supports outreach through the Be-a-Buddy Program to share life-saving information with particularly vulnerable populations. 

To prepare for future increases in temperature, the city promotes several resiliency strategies. These strategies are designed to moderate the urban heat island effect and reduce the severity and frequency of future projected heat events. Strategies include:

  • Green infrastructure.
  • Reforestation.
  • Reflective, or “cool” roofs.

New York City is continuing to evaluate their vulnerability and the effectiveness of its preparedness and resiliency actions using the most up-to-date information.

How Did They Do It?Applicable EPA Tools

Assessed and analyzed vulnerabilities within the 2013 Climate Risk Information Report.

  • Derived temperature and precipitation projections using a matrix of 35 Global Climate Model simulations under two Representative Concentration Pathways (RCPs).
    • Learn more at OSTI.gov.
  • Identified an average baseline of 2 heat waves per year between 1970-2000. Under the 90th percentile high estimate, the number of heat waves could increase to up to 7 per year by 2050. The number of days over 90°F could triple from an average baseline of 18 days to 57 days by 2050.
  • Incorporated this risk assessment within local hazard mitigation plans.
  • Supported actions to reduce vulnerability and adapt to hotter conditions.

The National Climate Assessment can provide a broad projection of average temperature changes and heat risk for your region based upon emissions scenarios.

NOAA's Archival Repository: Fifth National Climate Assessment

Promoted resiliency to current temperature conditions, particularly for vulnerable populations.

  • NYC promotes resiliency through outreach efforts to particularly vulnerable populations including older adults, children, and those already suffering from chronic illnesses. One example, the “Be-a-Buddy Program” shares life-saving information with vulnerable residents. This and other similar programs constitute resiliency actions as they reduce vulnerability under current conditions and can be scaled accordingly. Note, these programs do not reduce the level of increased future risk.

CDC’s Heat & Health tracker helps identify the communities most at risk, including older adults and those experiencing mobility concerns.

CDC's Heat & Health Tracker*

* (This is a non-EPA resource from the Centers for Disease Control and Prevention.)

Implemented actions that provide co-benefits to air quality, water management and emergency preparedness.

  • NYC implemented several preparedness actions to address the increasing risk of heat events and to decrease the urban heat island effect. "Cool roofs," urban forestry initiatives, and other strategies are promoted to prepare for a projected increase in future heat waves.
  • NYC Cool Roofs Program began in 2009 as a volunteer program to support efforts to reduce the urban heat island effect. The program has evolved into a workforce development training opportunity that prepares local individuals to work with a team to coat city rooftops with a white reflective coating and earn construction sector credentials. In its 2013 Annual Report, the NYC Cool Roofs Program had “cooled and coated” 2,077,537 square feet of rooftop by utilizing over 1,000 local volunteers and funding from corporate and individual donations, sponsorships, and local government.
  • NYC adopted the Million Trees initiative to plant 1 million trees in the city by 2017. The city is now working towards planting 23 million trees by 2033. This action anticipates the future risks and provides preparedness benefits for reducing the urban heat island, as well as reducing greenhouse gas emissions.
EPA’s Excessive Heat Events Guidebook helps identify heat preparedness and resilience strategies. For more on using green infrastructure to provide co-benefits, see the “Reduce the Urban Heat Island Page.”

Evaluating performance and risk under the best-available science.

  • The city partnered with the Princeton Plasma Physics laboratory to help analyze, evaluate and quantify its resiliency, adaptation and preparedness actions.
  • The city updated its vulnerability assessment in 2015 (“Building the Knowledge Base for Climate Resiliency”), including projecting climate risk out to 2100 for the first time.

The Green Infrastructure to Reduce Urban Heat Island Effect webpage provides resources to model and evaluate the performance of green infrastructure strategies that reduce the urban heat island effect.

Green Infrastructure to Reduce Urban Heat Island Effect


Similar Cases

To see how New York conducted a vulnerability assessment for changing environmental conditions, view the NYC Heat Plan case. Remember, heat events and other disaster events can disproportionately impact at-risk or vulnerable communities. 

To view a case study that identifies and actively engaged vulnerable communities in adaptation planning for heat events, view Chicago Heat Emergency Response. To see how a community has used green infrastructure to both reduce the impact of future heat events and reduce stormwater runoff during extreme precipitation events, view Chicago, IL Uses Green Infrastructure to Reduce Heat Event Impacts.

  • NYC Heat Plan case
  • Chicago Heat Emergency Response
  • Chicago, IL Uses Green Infrastructure to Reduce Heat Event Impacts

References

  • NYC Cool Roofs: 2013 Annual Report (PDF)(13 pp, 12 MB, About PDF)
  • Heat Related Brief (PDF)(3 pp, 257 K)
  • NYC Panel on Climate Change: Climate Risk Information 2013, Observations, Climate Change Projections, and Maps (PDF)(38 pp, 1.2 MB)
  • NYC Climate and Health Website
  • US Climate Resilience Toolkit: Extreme Heat
  • New York City Panel on Climate Change 2015 Report, Chapter 5: Public Health Impacts and Resiliency

Climate Change Adaptation Resource Center (ARC-X)

  • Your Climate Adaptation Search
  • Case Studies
  • Tools
  • Training
  • Federal Funding & Technical Assistance
Contact Us About the Adaptation Resource Center
Contact Us About the Adaptation Resource Center to ask a question, provide feedback, or report a problem.
Last updated on August 6, 2025
  • Assistance
  • Spanish
  • Arabic
  • Chinese (simplified)
  • Chinese (traditional)
  • French
  • Haitian Creole
  • Korean
  • Portuguese
  • Russian
  • Tagalog
  • Vietnamese
United States Environmental Protection Agency

Discover.

  • Accessibility Statement
  • Budget & Performance
  • Contracting
  • EPA www Web Snapshot
  • Grants
  • No FEAR Act Data
  • Plain Writing
  • Privacy
  • Privacy and Security Notice

Connect.

  • Data
  • Inspector General
  • Jobs
  • Newsroom
  • Regulations.gov
  • Subscribe
  • USA.gov
  • White House

Ask.

  • Contact EPA
  • EPA Disclaimers
  • Hotlines
  • FOIA Requests
  • Frequent Questions
  • Site Feedback

Follow.