U.S. flag

An official website of the United States government

Here’s how you know

Dot gov

Official websites use .gov
A .gov website belongs to an official government organization in the United States.

HTTPS

Secure .gov websites use HTTPS
A lock (LockA locked padlock) or https:// means you’ve safely connected to the .gov website. Share sensitive information only on official, secure websites.

    • Environmental Topics
    • Air
    • Bed Bugs
    • Cancer
    • Chemicals, Toxics, and Pesticide
    • Emergency Response
    • Environmental Information by Location
    • Health
    • Land, Waste, and Cleanup
    • Lead
    • Mold
    • Radon
    • Research
    • Science Topics
    • Water Topics
    • A-Z Topic Index
    • Laws & Regulations
    • By Business Sector
    • By Topic
    • Compliance
    • Enforcement
    • Laws and Executive Orders
    • Regulations
    • Report a Violation
    • Environmental Violations
    • Fraud, Waste or Abuse
    • About EPA
    • Our Mission and What We Do
    • Headquarters Offices
    • Regional Offices
    • Labs and Research Centers
    • Planning, Budget, and Results
    • Organization Chart
    • EPA History

Breadcrumb

  1. Home
  2. Harmful Algal Blooms (HABs) in Water Bodies
  3. Trends, Monitoring Results & Forecasts

HAB Forecasts

A principal responsibility of the U.S. Environmental Protection Agency and National Oceanic and Atmospheric Administration (NOAA) is to provide monitoring and forecasting data on HABs across the United States. Users can access the following resources to find HABs forecasting information for U.S. waterbodies.

Freshwater Forecasts

EPA scientists developed a forecast model to predict weekly cyanobacterial HAB, or cyanoHAB, probability in lakes measured by the Cyanobacteria Assessment Network (CyAN) during the cyanoHAB season from March to November. The cyanoHAB forecast model predicts the weekly probability of a bloom (defined as median lake chlorophyll a ≥12 ug/L with cyanobacteria dominance) occurring in the coming week for over 2,000 of the largest U.S. lakes and reservoirs across the lower 48 states. The model predictions were validated with CyAN satellite data and have an overall prediction accuracy of 90 percent. Note that the forecast is not meant to replace regular sampling or observation, but to help inform those monitoring efforts.  

Learn about the development of those forecasts and how the data can be interpreted:

  • Cyanobacterial Harmful Algal Blooms Forecasting Research
  • Forecasting Model Publication – Schaeffer et al. 2024

The EPA has developed the following dashboards for viewing the weekly forecasts for each resolvable (what this satellite can see accurately) CyAN lake in the United States. The dashboards also provide past forecast information, forecast patterns and downloadable data.


Something to remember when interpreting these forecasts:

The value the forecast generates is a probability (or likelihood) from 0 to 100% that the lake or reservoir may experience a cyanobacteria dominated bloom in the next 7 days (where a bloom is defined as a lake-wide median surface chlorophyll a ≥12 ug/L over the lake area the satellite can see accurately).

As shown in Figure 1, the CyAN satellite generally does not resolve (“accurately see”) shallow areas along the edge of the lake, small embayments, narrow areas of the lake/reservoir, etc. This means lakes where blooms may be isolated or occur in small specific embayments may not register as having a high probability of a bloom at the scale of all the resolvable portions of the lake. Similarly, lakes/reservoirs that are long and thin may only have resolvable pixels in wider, more open segments where blooms may not occur as much.
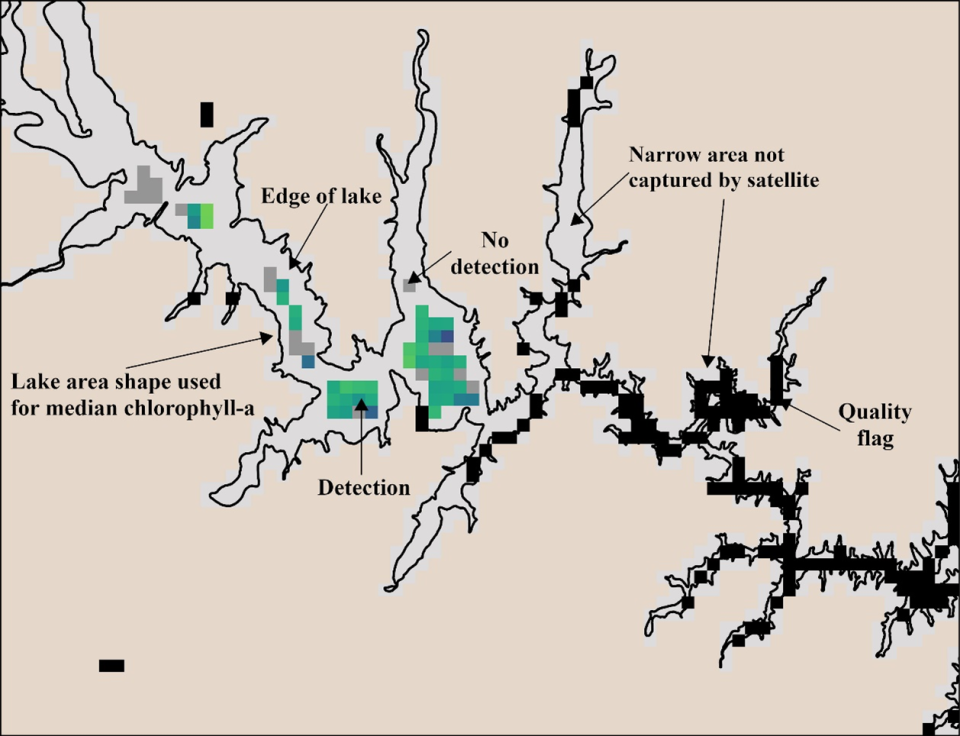
Example image from a CyAN lake showing the pixels captured by the satellite.
Figure 1. Example image from a CyAN lake showing the pixels captured by the satellite. Areas without pixels were not captured by the satellite. Black pixels were captured by the satellite, but did not pass quality control. Gray pixels were captured by the satellite and had no cyanobacterial chlorophyll detected. Other colored pixels were captured by the satellite and had detectable cyanobacterial chlorophyll.

Marine Forecasts

Similar to that for Lake Erie, NOAA, its partners, and collaborators serve forecasts for a number of coastal regions including the Gulf of America and Florida, the Gulf of Maine, the Pacific Northwest and California.

  • Gulf of America - NCCOS Coastal Science website
  • Gulf of Maine Alexandrium catenella Predictive Models - NCCOS Coastal Science website
  • Pacific Northwest – NANOOS website
  • California – SCCOOS website
  • HAB Forecasts - NCCOS Coastal Science website
Contact Us to ask a question, provide feedback, or report a problem.
Last updated on April 8, 2025
  • Assistance
  • Spanish
  • Arabic
  • Chinese (simplified)
  • Chinese (traditional)
  • French
  • Haitian Creole
  • Korean
  • Portuguese
  • Russian
  • Tagalog
  • Vietnamese
United States Environmental Protection Agency

Discover.

  • Accessibility Statement
  • Budget & Performance
  • Contracting
  • EPA www Web Snapshot
  • Grants
  • No FEAR Act Data
  • Plain Writing
  • Privacy
  • Privacy and Security Notice

Connect.

  • Data
  • Inspector General
  • Jobs
  • Newsroom
  • Regulations.gov
  • Subscribe
  • USA.gov
  • White House

Ask.

  • Contact EPA
  • EPA Disclaimers
  • Hotlines
  • FOIA Requests
  • Frequent Questions
  • Site Feedback

Follow.