
Three Keys to BMP Performance: Concentration, Volume, and Total Load
- Concentration
- Why Percent Removal is a Poor Measure of BMP Performance
- Volume and Total Load
- How Volume Reduction Can Play a Significant Role in Pollution Reduction
- Additional Information
Concentration
What is the concentration of the pollutant leaving the best management practice (BMP) and being discharged into the environment?
Usually measured in milligrams or micrograms per liter (mg/L and ug/L, respectively), this information is necessary for calculating a total load (discussed below) and can be useful, particularly when trying to meet a specific water quality objective.
Why Percent Removal is a Poor Measure of BMP Performance
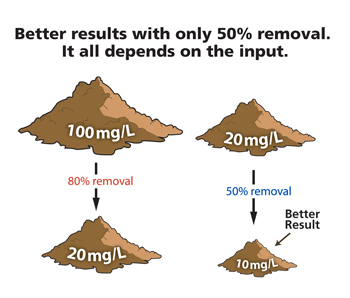
Taking the inflow and outflow concentrations and calculating a "percent removal" is not recommended. As the simplified example below shows, the relationship of input (concentration of pollutant coming into the BMP) and output can make reliance on percent removal very misleading. The BMP on the left side of the diagram removes 80 percent of the pollutant but discharges 20 mg/l of the pollutant. The BMP on the right side of the diagram removes 50 percent of the pollutant, but discharges only 10 mg/l. Therefore, the BMP that removes only 50 percent of the pollutant actually achieves a better water quality result. If you rely only on percent removal, you might choose the incorrect BMP.
BMP performance should be evaluated over a wide range of real-world conditions, including varying rainfall events, soil types, and land uses. You also should consider the volume reduction potential of any BMP both for its own sake and for its impact on total load reduction of pollutants (see discussion below).
- For additional information, see the International Stormwater BMP Database report: "Why does the International Stormwater BMP Database Project omit percent removal as a measure of BMP performance? "
BMP performance varies widely based on location, design, rainfall patterns, surrounding land uses, and monitoring variability among other factors. Nonetheless, outflow concentration information can be useful in comparing classes of BMPs or in investigating the impact of design changes on the overall performance of a particular BMP.
Volume and Total Load
Evaluating the volume reduction potential of a BMP is critical in assessing its overall performance. One of the primary impacts of stormwater is related to the increased volumes of surface runoff that are a direct result of increased impervious surfaces in urbanized watersheds.
Increasing impervious surface in a watershed changes the natural hydrology and increases the amount of water transported in surface flow. These changes can have significant impacts on smaller and medium-sized streams and rivers and the riparian areas that protect them. Streambank erosion, channel deformation and down cutting, and loss of natural habitat are among the more common impacts of increased runoff from impervious surfaces. Choosing BMPs that reduce volumes through infiltration and evapotranspiration can be essential to protecting or restoring watersheds.
Volume reduction also can play a significant role in overall pollutant load reduction, which may not be immediately apparent if concentration numbers are compared. When a BMP, such as a rain garden or bioretention practice, captures a portion of incoming runoff and infiltrates it into the soil, the pollutants in that portion are prevented from entering a nearby river, lake, or coastal water. Simply comparing the concentration in and the concentration out does not account for this reduction in the total load of the pollutant that has been reduced.
How Volume Reduction Can Play a Significant Role in Pollution Reduction
Probably the best way to evaluate overall BMP performance for a particular pollutant is to estimate the total load of the pollutant that might be removed by a BMP. Total load can be calculated using the volume of water that is discharged from the BMP over a given period multiplied by the mean or average concentration of the pollutant. However, most studies do not calculate the total load discharged or reduced.
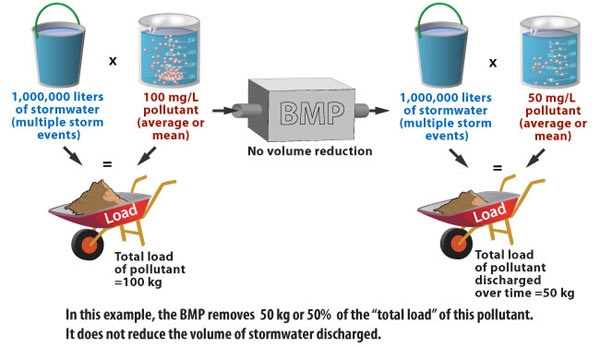
The graphic below illustrates a BMP that removes pollutants but does not reduce the total volume of stormwater treated and discharged. In this hypothetical example, 1 million liters of stormwater from several storm events are treated by the BMP. The average concentration of the pollutant coming into the BMP is 100 mg/l. Multiplying volume by concentration provides the total load, 100 kg, of the pollutant coming into the BMP during the storm events. The volume of water leaving the BMP remains unchanged and the concentration of the pollutant has been reduced to 50 mg/l, resulting in a total load of 50 kg of the pollutant being discharged during storm events.
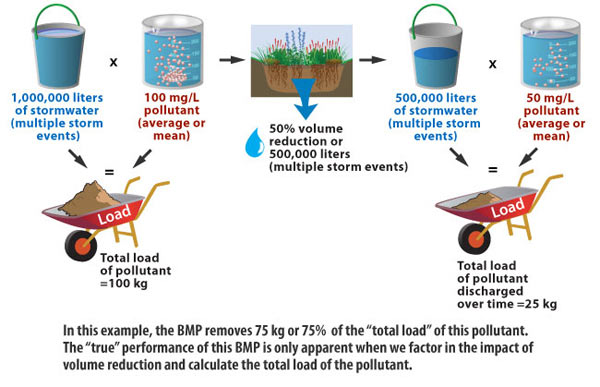
In the example below, the BMP examined reduced the total volume of stormwater discharged by 50 percent. The same 1 million liters comes into the BMP at an average concentration of 100 mg/l, resulting in a total incoming load of 100 kg. This BMP infiltrates 50 percent of the stormwater, so 500,000 liters is discharged into the environment. This BMP also reduces the concentration of the pollutant to 50 mg/l; however, multiplying the reduced volume by the concentration results in a total of 25 kg of the pollutant being discharged. Note that if the effluent concentration values (50 mg/l) were compared or if a "percent removal" were calculated using the incoming and outgoing concentrations, the performance of the BMPs would have appeared equal.
Additional Information
- International Stormwater BMP Database report: "Overview of Performance by BMP Category and Common Pollutant Type"
- National Pollutant Removal Performance Database (PDF) (10 pp, 1.18 MB, About PDF), Version 3, Sept. 2007, Center for Watershed Protection
Note: Total load reduction can be estimated in several ways. The best way is to monitor a particular BMP for every rain event over several years, carefully monitoring the volume of water coming into and leaving the BMP and the concentrations of a given pollutant in multiple samples for each rain event. However, this level of monitoring is rarely possible. More commonly, a BMP is monitored for a limited number of rain events with multiple samples taken for each event.