
Making Miniature Models to Track Air Pollution
Published February 11, 2025
Tucked behind the interstate in Research Triangle Park, North Carolina, is one of the few large meteorological wind tunnels in the country. For fifty years, EPA researchers have studied air flow and dispersion in this unique lab, using scaled models to simulate the spread of harmful airborne material released in urban and industrial settings. Measuring how air flows around scaled model buildings and where pollution goes helps determine how exposure to pollutants affects public health.
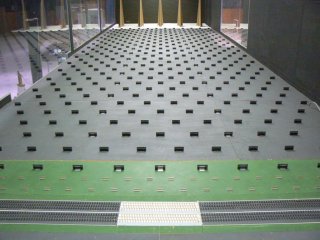
Walk into the large warehouse that contains EPA’s Fluid Modeling Facility Meteorological Wind Tunnel lab and you’ll immediately notice a 1:200 scale model of the Pentagon on the wall. Decades ago, Operation Pentagon Shield was carried out to help the Pentagon estimate exposure from a potential attack on the building.
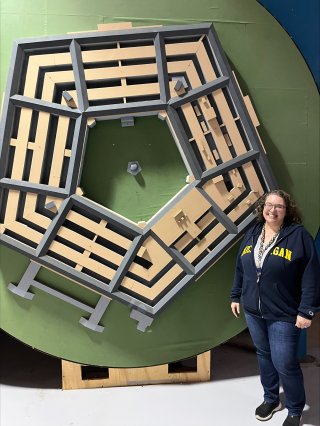
Move on and you’ll pass a model inspired by a Detroit neighborhood -- with a combination of residential and commercial buildings -- sitting on a giant 10 diameter turntable. This allows researchers to rotate the model in the wind tunnel to simulate different wind directions.
Making the Models
The models used in the wind tunnel aren’t bought ready-made: they’re all designed and handmade by the researchers. They can usually get building dimensions from city databases and sources like LIDAR scans.
“Most models are built from wood or foam. Foam is durable, easy to cut, and lightweight, which is especially important for larger models. But cutting foam is super messy and creates a lot of dust in the workshop,” said researcher Laurie Brixey.
The scientists recently began using a 3D printer to print plastic models. The process is very slow, but they run the printer overnight to maximize efficiency. Scientists sometimes choose a particular model color so they can better track pollution migration or distinguish model building height. Often with the 3D printer, they use whatever color they have on hand.
What Is a Meteorological Wind Tunnel?
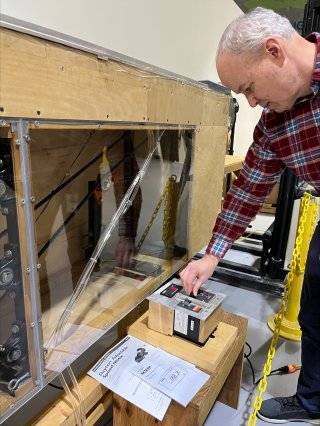
These specialized tunnels use lower wind speeds (usually less than 8 meters per second) and must be able to fit scaled models big enough to accurately measure the tested conditions. When harmful materials are released into the air in an urban area, they can also impact areas downwind. The EPA wind tunnel test section measures 3.65 meters (12 feet) across and 2.1 meters (almost 7 feet) tall, giving scientists plenty of space to study what happens downwind from a source. Building shapes and sizes, along with their orientation to streets, affect quantity and direction of pollutants in the wind flow.
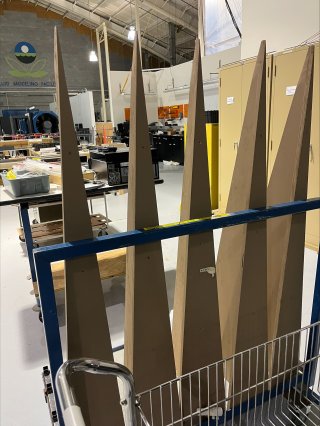
In a modeling facility like a wind tunnel, researchers can control everything, including wind direction, source locations, and amount of pollutant. The scientists can also generate different amounts of turbulence with triangular spires and roughness elements on the tunnel floor to simulate landscape features.
Projects in Progress
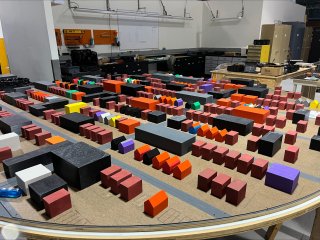
One of the current wind tunnel projects mimics an oil and gas facility outside Denver, Colorado, an area that sometimes experiences unhealthy air quality levels. Field study data can provide information about facility emissions and local air quality impacts, however, gathering field data has limitations, including cost and the weather conditions at the time. Researchers are using the field study data to determine the correct environment— high desert in this case—and “roughness” of the landscape, which affect air flow.
Alex Pezold, an Oak Ridge Associated Universities Research participant with EPA, printed out a mini-mockup of the model at a scale of 1:480. Once he determines the correct configuration of the buildings, he’ll construct the model on a 1:50 scale. The results from the project will help determine whether refinements may be needed to EPA’s air quality model to represent these sources more accurately.

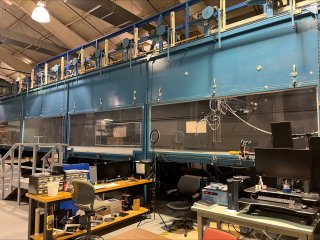
Another project in the works is an ongoing collaboration with the U.S. Federal Highway Administration to improve the understanding of how vehicle emissions disperse around a roadway.
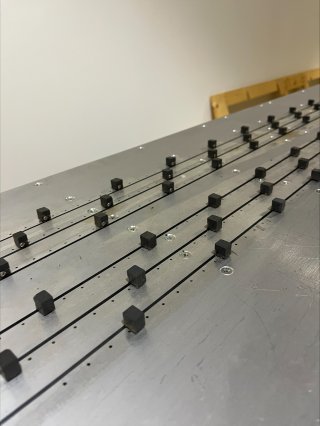
“We’ve designed a moving model to simulate a six-lane divided highway, with blocks representing cars travelling in both directions. Small holes in the base of the road are connected to tubes, allowing us to pipe tracer gas emissions onto the roadway,” said EPA scientist David Heist. “The entire model, including the motor and emissions system, was built from scratch by now-retired researcher Roger Thompson.”
What Happens in the Wind Tunnel Doesn’t Stay in the Wind Tunnel
Data from models used in EPA’s Wind Tunnel lab has been used by states, Tribes, local agencies and EPA to inform decision-making on air quality issues, and to evaluate mitigation options. Research conducted in the wind tunnel lab improves current regulatory and fast-response models used by decision makers for better permitting decisions, emergency planning, and recovery. One of the Fluid Modeling Facility team’s most recent accomplishments includes updates to EPA’s regulatory dispersion model (AERMOD) which is based on data originally collected in the wind tunnel.
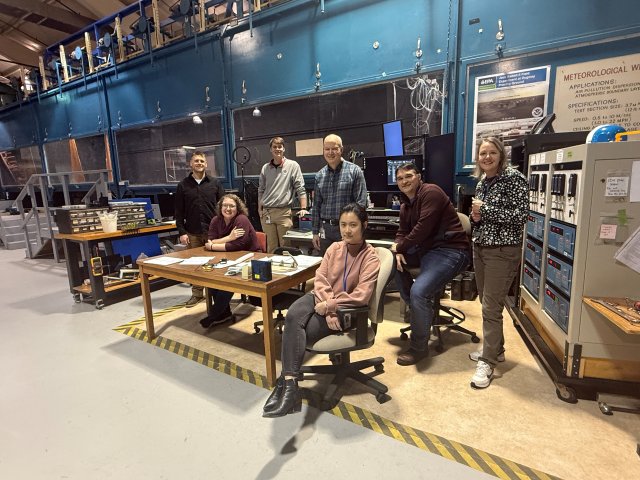
The research team celebrated the wind tunnel’s 50th birthday last year. Here’s to another 50 years of data collection!
This article was written by EPA’s Melissa Payne.