Water Quality Data Download
-
Main Water Quality Data (WQX) Page
This returns users to the Water Quality Data (WQX) landing page.
-
Water Quality Data Upload with WQX

The Water Quality eXchange (WQX) is a universal format for sharing water quality data. Users can prepare their data for upload using spreadsheet Templates, develop custom imports in WQXWeb, or submit WQX-ready data via the Exchange Network.
-
Learn More about Water Quality Data

General Information, Data Assistance, Tools, Training Videos, User Community, and Funding. Learn how to get "1 on 1" data assistance with WQX .
Water quality data submitted from over 1,500 federal, state and tribal agencies, watershed organizations and other groups are available to support your water quality analyses. Water quality data includes physical, chemical, biological, habitat, metrics and indexes data.
- Water Quality Portal
- Water Quality Portal Resources
- Agency Tools Using the WQP
- Legacy Data
- Example Using WQP Web Services
Water Quality Portal
The Water Quality Portal is a cooperative service sponsored by the United States Geological Survey, the Environmental Protection Agency and the National Water Quality Monitoring Council. It serves over 430 million water result records from EPA's Water Quality eXchange, the USGS National Water Information System, numerous other federal, state, Tribal, and local government agencies, researchers, and the public.
- Visit the Water Quality Portal
- Tools for Automated Data Analysis (TADA) - A series of R tools designed to help Tribes, Tribal Nations, Pueblos, States and stakeholders more efficiently compile and evaluate Water Quality Portal (WQP) data collected from water monitoring sites.
- Water Quality Portal MOU between the U.S. Geological Survey and U.S. Environmental Protection Agency.
Water Quality Portal Resources
- Water Quality Portal Quick Reference Guide
- Video short: How to Use the Water Quality Portal
- WQX 101 Course Class 8 - Finding and Using Data from the Water Quality Portal
- dataRetrieval - An R package designed to help users retrieve data from the WQP
- USGS Water Data for the Nation blog (Water Quality Portal posts)
Agency Tools Using the WQP
The Water Quality Portal is a foundation for public information tools. This means that products and applications can be constructed that call the WQP for updated data to be displayed as information or used in further analysis or visualizations. This is a small list of agency products that were either constructed with or regularly consume WQP data.
-
How’s My Waterway – EPA’s flagship public information viewer for Clean Water Act information. How’s My Waterway integrates data and information from over 30 separate data sources, including the Water Quality Portal.
-
Tools for Automated Data Analysis (TADA) - A series of R tools designed to help Tribes, Tribal Nations, Pueblos, States and stakeholders more efficiently compile and evaluate Water Quality Portal (WQP) data collected from water monitoring sites.
- Water Quality Indicators (WQI) Tool - A screening tool that makes it easy to identify pollutant hotspots based on water quality monitoring data from the U.S. Water Quality Portal.
- EPA’s Estuary Data Mapper (EDM) - Helps researchers and estuary managers pull historic and current data on estuary conditions along five US coastal regions.
- CyAN - CyAN is a multi-agency project to develop an early warning indicator system to detect algal blooms in U.S. freshwater systems.
- Freshwater Explorer - An interactive web-based mapping tool for water quality parameters of freshwater streams, lakes, and groundwater wells in all 50 U.S. states, Puerto Rico, and the U.S. Virgin Islands.
- Monitoring for Harmful Algal Toxins StoryMap
*There are also many external tools that have been created to use and display data from the Water Quality Portal.
Legacy Data
The LDC (Legacy Data Center) contains historical water quality data dating back to the early part of the 20th century and collected up to the end of 1998. Data is no longer being placed in the Legacy Data Center, but the public can still access legacy data from the ftp site.
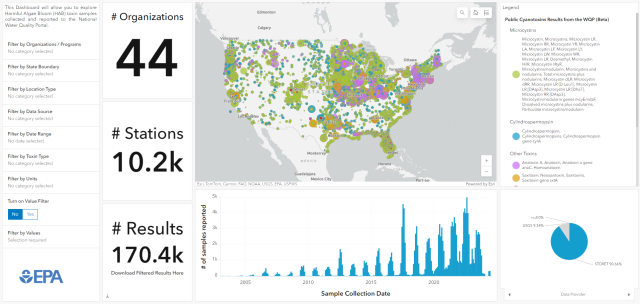
Example Using WQP Web Services in Applications
WQP data may be accessed through web services that can power applications, helping to turn water quality data into public information. The following example is a StoryMap and dashboard that highlights Harmful Algae Bloom Cyanotoxin samples collected by programs across the country. The StoryMap uses two calls to the WQP for information. The first call to the WQP summary service can be used to produce the map of Who is Monitoring for Algal Toxins and shows where and how much monitoring is taking place. The second data query pulls down all Cyanotoxin Result data and can produce maps and dashboards showing sample concentrations.