U.S. flag

An official website of the United States government

Here’s how you know

Dot gov

Official websites use .gov
A .gov website belongs to an official government organization in the United States.

HTTPS

Secure .gov websites use HTTPS
A lock (LockA locked padlock) or https:// means you’ve safely connected to the .gov website. Share sensitive information only on official, secure websites.

    • Environmental Topics
    • Air
    • Bed Bugs
    • Cancer
    • Chemicals, Toxics, and Pesticide
    • Emergency Response
    • Environmental Information by Location
    • Health
    • Land, Waste, and Cleanup
    • Lead
    • Mold
    • Radon
    • Research
    • Science Topics
    • Water Topics
    • A-Z Topic Index
    • Laws & Regulations
    • By Business Sector
    • By Topic
    • Compliance
    • Enforcement
    • Laws and Executive Orders
    • Regulations
    • Report a Violation
    • Environmental Violations
    • Fraud, Waste or Abuse
    • About EPA
    • Our Mission and What We Do
    • Headquarters Offices
    • Regional Offices
    • Labs and Research Centers
    • Planning, Budget, and Results
    • Organization Chart
    • EPA History

Breadcrumb

  1. Home
  2. Causal Analysis/Diagnosis Decision Information System (CADDIS)

Basic Analyses

  • Tests
  • Regression Analysis
  • Quantile Regression
  • CART Analysis
  • References

Additional Information on Quantile Regression

Helpful Links
On This Page
  • Is the Assumed Functional Form Appropriate?
  • Are there Other Assumptions with Quantile Regression?

Back to: Quantile Regression


Authors

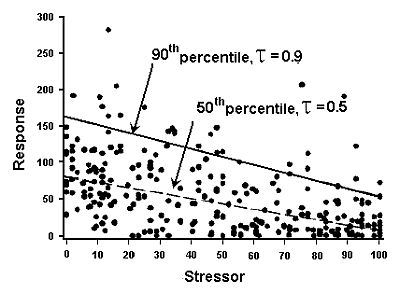
Quantile regression models the relationship between a specified conditional quantile (or percentile) of a dependent (response) variable and one or more independent (explanatory) variables (Cade and Noon 2003). For example, modeling the 50th quantile of a response variable produces the median line under which 50% of the observed responses are located, and modeling the 90th quantile produces a line under which 90% of the observed responses are located below (in Figure 1).

Figure 1. Quantile regression of matched data for a stressor and a response with the 50th and 90th percentiles noted.

Like conventional linear regression, a common functional form that is assumed for a quantile regression analysis may be a linear model:

A common functional form that is assumed for a quantile regression analysis may be a linear model
where yτ denotes the τth quantile of y, βi are constant coefficients, x1 is the explanatory variable. Quantile regressions can have more than one explanatory variable, but we limit the following discussion to the univariate case.

Quantile regression as illustrated in Figure 1 is a semi-parametric method (i.e., combines parametric and nonparametric methods). A given quantile may be assumed related linearly to the independent (response, Y-axis) variable, but the distribution of Y at a given X is not assumed to have a normal distribution. Moreover, other specific assumptions, such as homogeneity of variance do not apply.

Quantile regression is robust to outliers in dependent (response, Y-axis) variables, but is sensitive to points sparsely distributed toward the extremes of the independent (explanatory, X-axis) variables. In cases where such leverage points are present, one may do a weighted quantile regression. The influence of outliers, censored data, data clusters, and leverage points may be evaluated by comparing plots after removing (or, in the case of leverage points, weighting) these points. Any data pruning of this nature must be transparently described. In general, the points should remain on the plot with flags indicating whether they were weighted or omitted from the model.

Is the Assumed Functional Form Appropriate?

Although non-linear quantile regression analyses are available, a simplifying assumption is that the relationships being modeled are linear with respect to the explanatory variables. In Figure 1, the relationships between response variable and the explanatory variable is assumed to be linear. In many cases, a linear relationship is a reasonably accurate estimate of the actual relationship, if there is no reason to believe differently. Most biotic metrics are generally considered to change linearly in relation to stressor gradients, but ecological knowledge of the underlying processes may help one select alternate functional forms.

Are there Other Assumptions with Quantile Regression?

An assumption for using the 90th percentile is that the data wedge often observed in scatter plots of biological metrics is the result of other stressors co-occurring with the modeled stressor which cause additional decline in biological response over the stressor gradient.

If data from the impaired site are located far outside the upper boundary determined from regional data, it may be an indication that the comparison to the regional data is not valid. This situation can arise for a variety reasons. For example, field sampling methods applied at the impaired site may differ significantly from those applied to collect the regional data. In general, large outliers should be inspected carefully to determine whether they can be usefully compared to regional data.

Causal Analysis/Diagnosis Decision Information System (CADDIS)

  • CADDIS Home
    • About CADDIS
    • Frequent Questions
    • Publications
    • Recent Additions
    • Related Links
    • CADDIS Glossary
  • Volume 1: Stressor Identification
    • About Causal Assessment
    • Getting Started
    • Step 1. Define the Case
    • Step 2. List Candidate Causes
    • Step 3. Evaluate Data from the Case
    • Step 4. Evaluate Data from Elsewhere
    • Step 5. Identify Probable Causes
  • Volume 2: Sources, Stressors and Responses
    • About Sources
      • Urbanization
    • About Stressors
  • Volume 3: Examples and Applications
    • Analytical Examples
    • Worksheet Examples
    • State Examples
    • Case Studies
    • Galleries
  • Volume 4: Data Analysis
    • Selecting an Analysis Approach
    • Getting Started
    • Basic Principles & Issues
    • Exploratory Data Analysis
    • Basic Analyses
    • Advanced Analyses
    • PECBO Appendix
    • Download Software
    • Data Analysis Topics (A -Z)
  • Volume 5: Causal Databases
    • Learn about CADLink
Contact Us about CADDIS
Contact Us to ask a question, provide feedback, or report a problem.
Last updated on February 7, 2025
  • Assistance
  • Spanish
  • Arabic
  • Chinese (simplified)
  • Chinese (traditional)
  • French
  • Haitian Creole
  • Korean
  • Portuguese
  • Russian
  • Tagalog
  • Vietnamese
United States Environmental Protection Agency

Discover.

  • Accessibility Statement
  • Budget & Performance
  • Contracting
  • EPA www Web Snapshot
  • Grants
  • No FEAR Act Data
  • Plain Writing
  • Privacy
  • Privacy and Security Notice

Connect.

  • Data
  • Inspector General
  • Jobs
  • Newsroom
  • Regulations.gov
  • Subscribe
  • USA.gov
  • White House

Ask.

  • Contact EPA
  • EPA Disclaimers
  • Hotlines
  • FOIA Requests
  • Frequent Questions
  • Site Feedback

Follow.