U.S. flag

An official website of the United States government

Here’s how you know

Dot gov

Official websites use .gov
A .gov website belongs to an official government organization in the United States.

HTTPS

Secure .gov websites use HTTPS
A lock (LockA locked padlock) or https:// means you’ve safely connected to the .gov website. Share sensitive information only on official, secure websites.

    • Environmental Topics
    • Air
    • Bed Bugs
    • Cancer
    • Chemicals, Toxics, and Pesticide
    • Emergency Response
    • Environmental Information by Location
    • Health
    • Land, Waste, and Cleanup
    • Lead
    • Mold
    • Radon
    • Research
    • Science Topics
    • Water Topics
    • A-Z Topic Index
    • Laws & Regulations
    • By Business Sector
    • By Topic
    • Compliance
    • Enforcement
    • Laws and Executive Orders
    • Regulations
    • Report a Violation
    • Environmental Violations
    • Fraud, Waste or Abuse
    • About EPA
    • Our Mission and What We Do
    • Headquarters Offices
    • Regional Offices
    • Labs and Research Centers
    • Planning, Budget, and Results
    • Organization Chart
    • EPA History

Breadcrumb

  1. Home
  2. EcoDIVER

Stream Nutrients Project

On this page:
  • Background
  • Nutrient Systematic Reviews
  • View the Evidence

Background

Eutrophication of freshwater ecosystems resulting from nitrogen and phosphorus pollution is an issue across the globe. Despite recognition of the problem by scientists and stakeholders, decision-makers still need rigorous synthesis of scientific evidence for nutrient management, especially in streams and rivers. Drawing inferences about how nitrogen and phosphorus concentrations affect stream biota is complicated by:

  • Exposure to multiple interacting environmental factors;
  • Complex and indirect causal pathways involving diverse organisms;
  • Legacy (historic) nutrient sources; and
  • The naturally high spatial and temporal variability of running water systems.

The Stream Nutrient Project aims to empower stakeholders to identify, manage, and restore streams and rivers impaired by eutrophication and maintain currently unimpaired systems. A critical first step is to determine the nutrient levels that affect ecosystems.


Nutrient Systematic Reviews

EPA conducted systematic reviews of the scientific literature to examine how nutrient stressors affect algae and macroinvertebrates in stream and river ecosystems. These reviews comprehensively synthesized published studies investigating how total nitrogen and total phosphorus concentrations affect three biological responses:

  1. Chlorophyll a (benthic and sestonic);
  2. Diatoms; and
  3. Benthic macroinvertebrates.

The Stream Nutrients Project collates the evidence records created in these reviews and makes them available to EcoDIVER users. After screening thousands of articles, we identified nearly 300 relevant documents, published from 1972-2018. Each of these documents reported at least one quantitative relationship between nutrient stressors and biological responses. We created evidence records by extracting more than 200 categorical and quantitative fields of information for each of these relationships.


View the Evidence

Tips for viewing and interacting with the visualizations

  • If possible, view the visualizations on a laptop or desktop computer using the maximum window size. When using a mobile device or viewing the visualizations in a small window, the layout may change (e.g., new panels may display below the initial panel rather than to the right of the initial panel) and titles or axis labels may be cut off. Remember to scroll right and/or down in the window to see visualizations in their entirety.
  • You may see empty boxes when you first click on the heat map or modified boxplot visualizations, as the visualization retrieves the data. There may also be a short delay for maps and distribution plots to update as filters are applied.
  • Each visualization includes helpful information on how to view and interact with that visualization, under either the blue Help button at the top right of the visualization (for the heat map, box plot, and forest plot visualizations) or in the text at the top of the visualization (for the map-based and histogram visualizations). Please read this information before interacting with the visualizations.
  • The heat map and modified boxplot visualizations all work in the same general fashion: (i) an initial figure is displayed at the left; (ii) hovering over a cell or panel in that figure displays relevant summary information; and (iii) clicking on a cell or sample size (n) value in that figure displays a data table or additional figure at the right (or below, if you are viewing the visualization in a small window).
  • If you scroll when your cursor is hovering over plots in the map-based and histogram visualizations, you will zoom in/out on these plots to view information at different scales.
  • See the Stream Nutrients Visualization Guide page for additional information on how to navigate specific visualizations.
What are you interested in? Visualization Type Description/Link Thumbnail
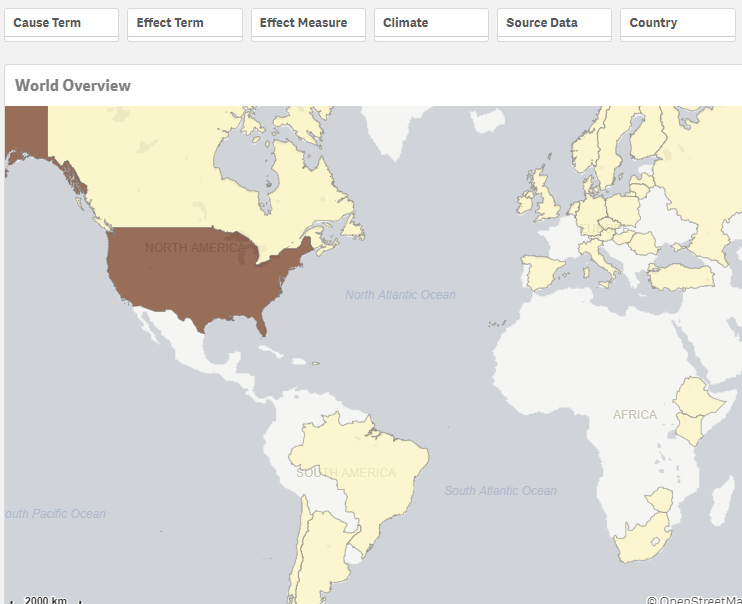
Nutrient stressor-biological response evidence by country Map-based summary of evidence base World overview of evidence base for all nutrient stressor-biological response relationships
Screenshot thumbnail for nutrient-endpoint evidence by country
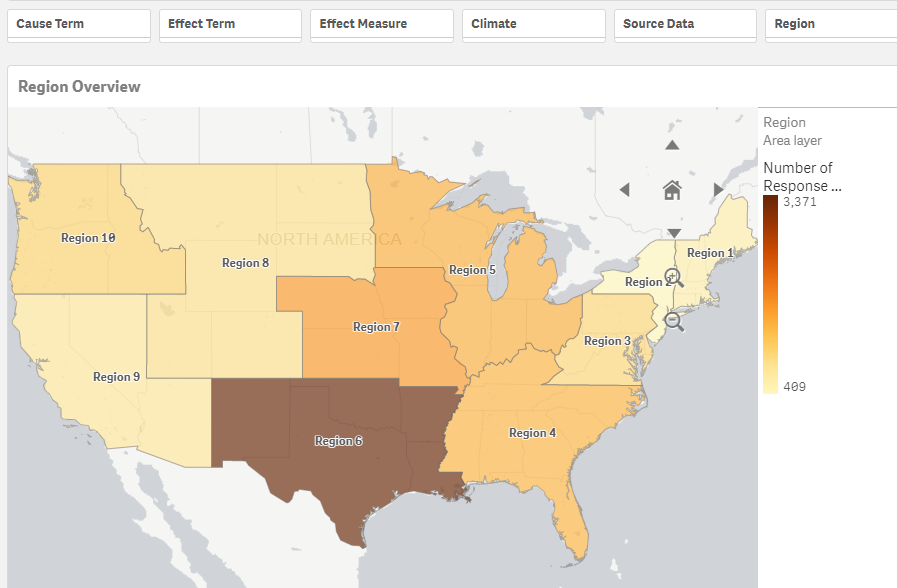
Nutrient stressor-biological response evidence by EPA region Map-based summary of evidence base EPA region overview of evidence base for all nutrient stressor-biological response relationships
Screenshot thumbnail for nutrient-endpoint evidence by EPA region
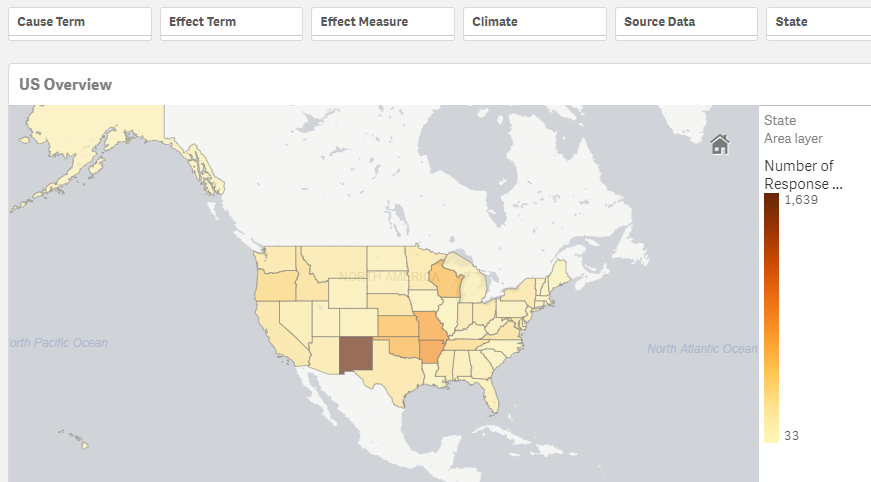
Nutrient stressor-biological response evidence by US state Map-based summary of evidence base State overview of evidence base for all nutrient stressor-biological response relationships
Screenshot thumbnail for nutrient evidence by US state
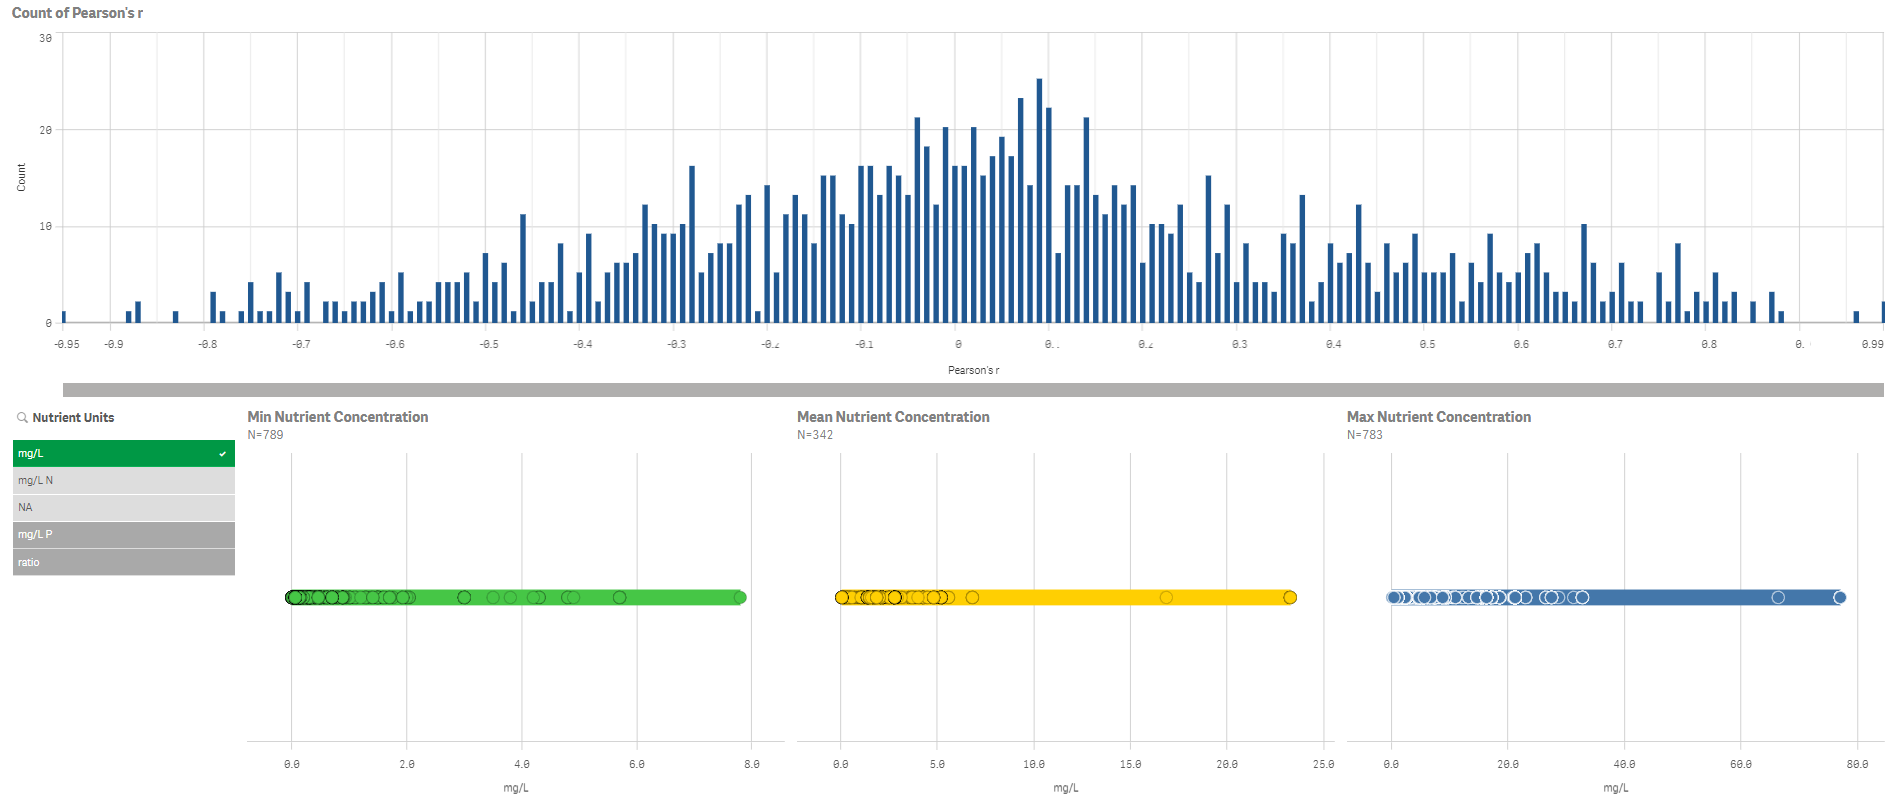
Other environmental conditions Bar charts and distribution plots Filterable bar charts and distribution plots of environmental conditions under which nutrient stressor-biological response relationships were measured
Screenshot thumbnail for bar chart of environmental conditions
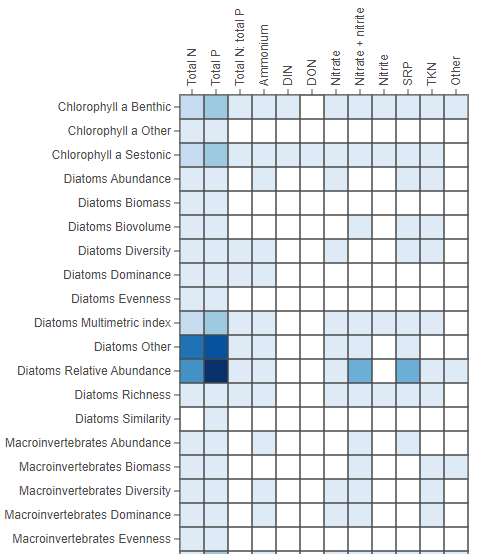
All biological responses by geographic location Heat map Heat map of citations for each nutrient stressor-biological response combination, filterable by country or US state
Screenshot thumbnail for heat map of nutrient-endpoint evidence
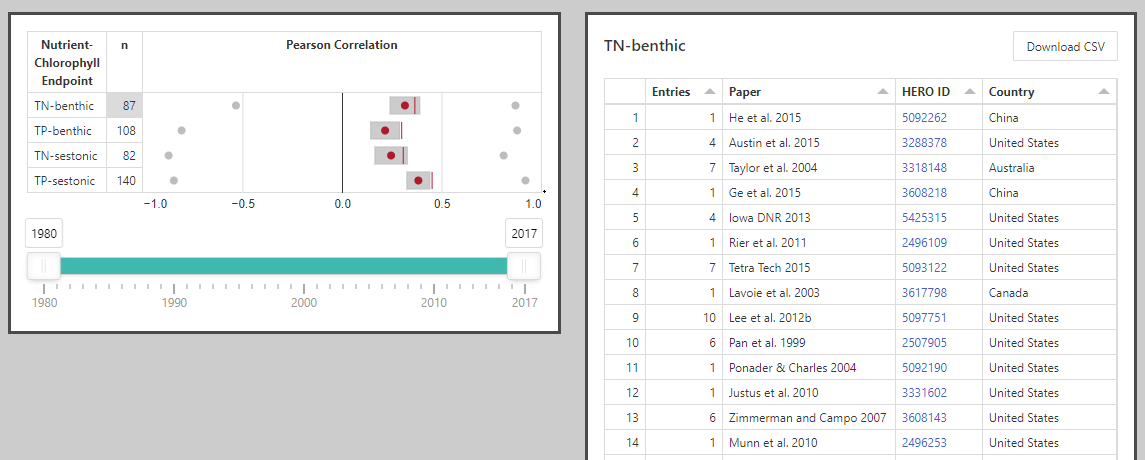
Chlorophyll a summary effect sizes Box plot Box plot of summary effect sizes and citations for 4 nutrient stressor-chlorophyll response relationships
Screenshot thumbnail for box plot of chlorophyll summary effect sizes
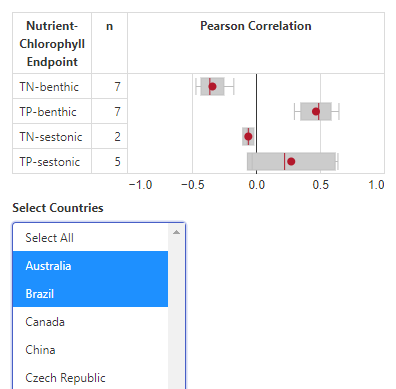
Chlorophyll a summary effect sizes by geographic location Box plot Box plot of summary effect sizes and citations for 4 nutrient stressor-chlorophyll response relationships, filterable by country or US state
Screenshot thumbnail for chlorophyll summary effect sizes for geographic location
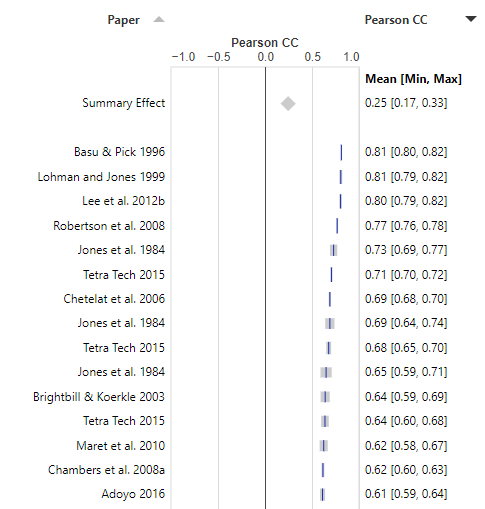
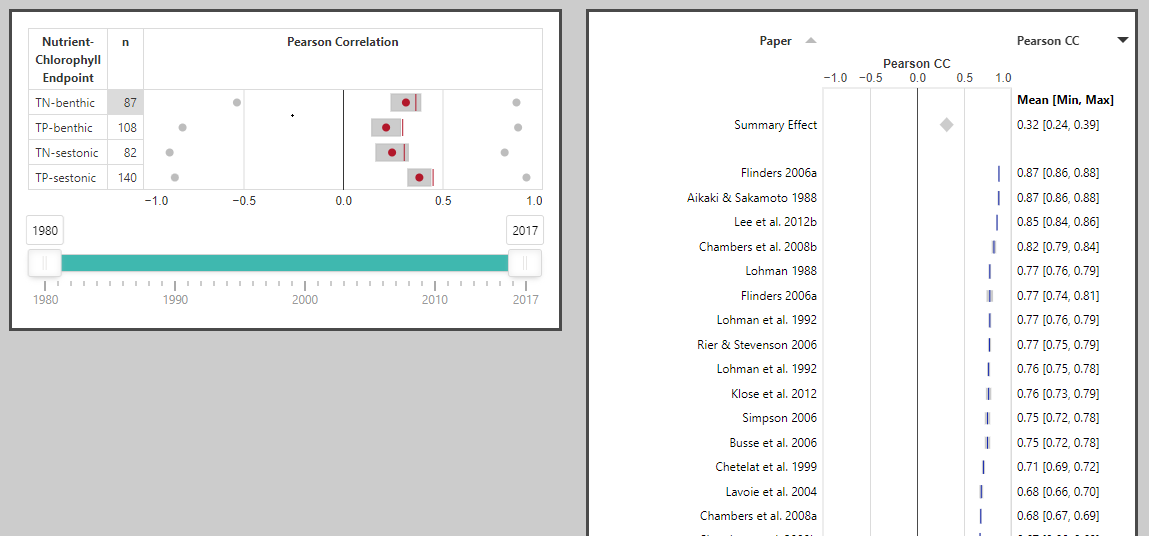
Chlorophyll a individual study effect sizes Box plot + forest plot Box plot of summary effect sizes and forest plot of effect sizes by citation for 4 nutrient stressor-chlorophyll response relationships
Screenshot thumbnail for chlorophyll individual effect sizes
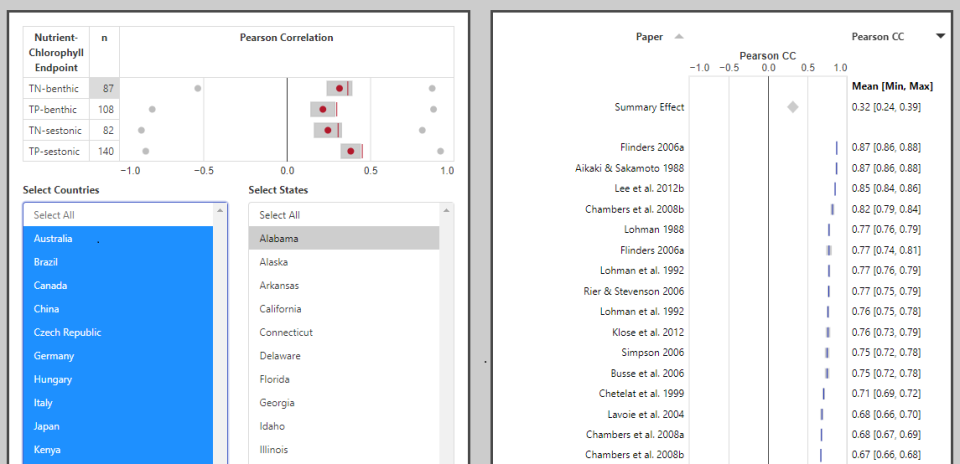
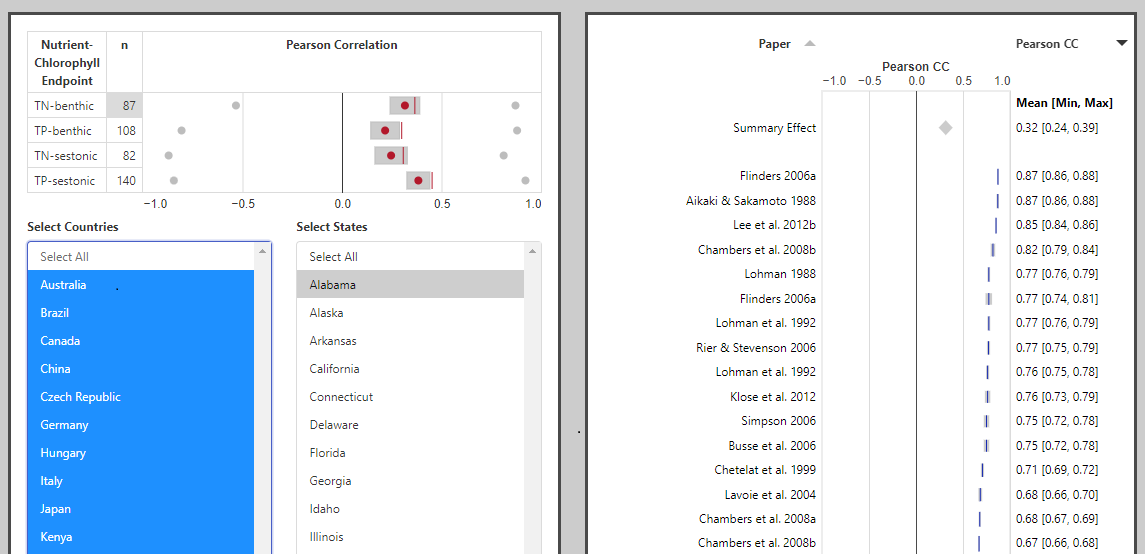
Chlorophyll a individual study effect sizes by geographic location Box plot + forest plot Box plot of summary effect sizes and forest plot of effect sizes by citation for 4 nutrient stressor-chlorophyll response relationships, filterable by country or US state
Chlorophyll a individual effect sizes by geographic location
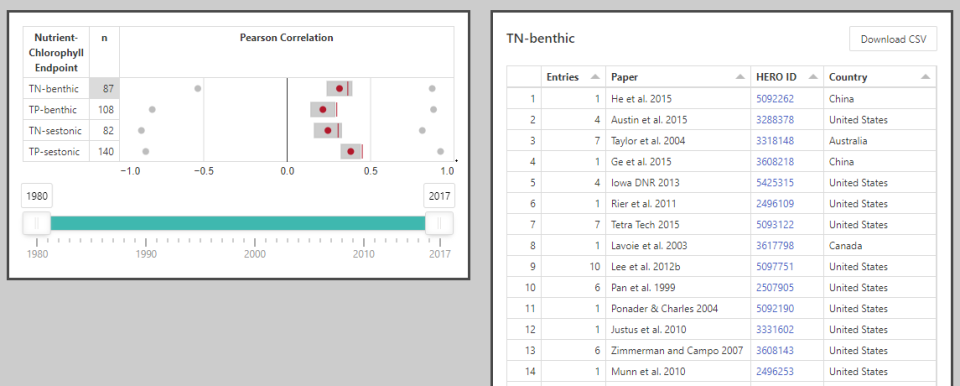
Chlorophyll a summary effect sizes by year of publication Box plot Box plot of summary effect sizes and citations for 4 nutrient stressor-chlorophyll response relationships, filterable by year of publication
Screenshot thumbnail for chlorophyll summary effect sizes by publication year
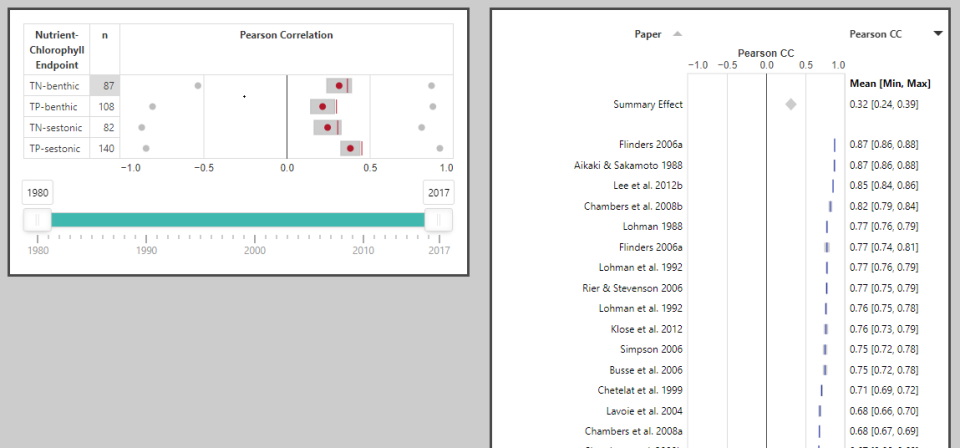
Chlorophyll a individual study effect sizes by year of publication Box plot + forest plot Box plot of summary effect sizes and forest plot of effect sizes by citation for 4 nutrient stressor-chlorophyll response relationships, filterable by year of publication
Screenshot thumbnail for chlorophyll individual effect sizes by publication year

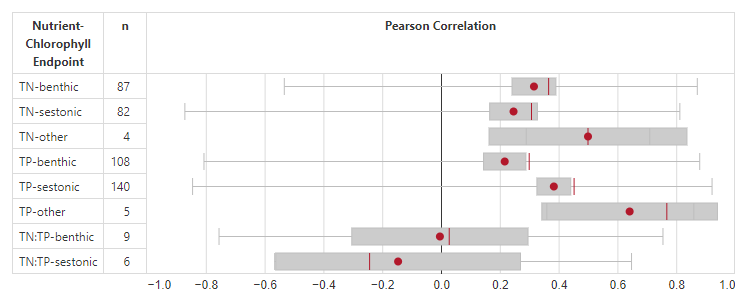
Full size image of All endpoints

All endpoints

Full size image of Chlorophyll a summary effect sizes

Chlorophyll a summary effect sizes

Full size image of Chlorophyll a summary effects sizes by geographic location

Chlorophyll a summary effects sizes by geographic location

Full size image of Chlorophyll a individual effect sizes

Chlorophyll a individual effect sizes

Full size image of Nutrient-endpoint evidence by country

Nutrient-endpoint evidence by country

Full size image of Nutrient-endpoint evidence by EPA region

Nutrient-endpoint evidence by EPA region

Full size image of Nutrient-endpoint evidence by US state

Nutrient-endpoint evidence by US state

Full size image of Other environmental variables

Other environmental variables

Full size image of Chlorophyll a individual effect sizes by geographic location

Other environmental variables

Full size image of Chlorophyll a summary effect sizes by year of publication

Other environmental variables

Full size image of Chlorophyll a individual effect sizes by year of publication

Other environmental variables

The visualizations for this project do not reflect study quality. Quality of evidence can vary based on factors such as study design and transparency of data collection and analysis methods. In addition, when filtering by geographic location, please keep in mind that filtered results may not be based solely on that geographic location (i.e., results may be based on data from the specified geographic location(s) combined with data from other locations). For the full details of any study included in this project, please consult the original citation.

You can view and download the list of articles included in the Stream Nutrients Project by visiting the Health and Environmental Research Online (HERO) project page for this effort. The full dataset of extracted data used in the Stream Nutrients Project is accessible from the Environmental Dataset Gateway.

Credits: Extracted dataset (Micah Bennett, David Gibbs, Sylvia Lee, Caroline Ridley, Kate Schofield); meta-analysis models (Micah Bennett, Sylvia Lee, Ben Washington); visualizations (Ray Burton, Nikhil Chakrapani, Tiffany Jones, Sylvia Lee, Caroline Ridley, Kate Schofield).

Citation: Bennett et al. 2021. Response of chlorophyll a to total nitrogen and total phosphorus concentrations in lotic ecosystems: a systematic review. Environmental Evidence 10:23.

EcoDIVER

  • About EcoDIVER
  • Stream Nutrients Project
    • Nutrients Visualization Guide
  • EcoDIVER Resources
Contact Us about EcoDIVER
Contact Us to ask a question, provide feedback, or report a problem.
Last updated on November 12, 2024
  • Assistance
  • Spanish
  • Arabic
  • Chinese (simplified)
  • Chinese (traditional)
  • French
  • Haitian Creole
  • Korean
  • Portuguese
  • Russian
  • Tagalog
  • Vietnamese
United States Environmental Protection Agency

Discover.

  • Accessibility Statement
  • Budget & Performance
  • Contracting
  • EPA www Web Snapshot
  • Grants
  • No FEAR Act Data
  • Plain Writing
  • Privacy
  • Privacy and Security Notice

Connect.

  • Data
  • Inspector General
  • Jobs
  • Newsroom
  • Regulations.gov
  • Subscribe
  • USA.gov
  • White House

Ask.

  • Contact EPA
  • EPA Disclaimers
  • Hotlines
  • FOIA Requests
  • Frequent Questions
  • Site Feedback

Follow.