U.S. flag

An official website of the United States government

Here’s how you know

Dot gov

Official websites use .gov
A .gov website belongs to an official government organization in the United States.

HTTPS

Secure .gov websites use HTTPS
A lock (LockA locked padlock) or https:// means you’ve safely connected to the .gov website. Share sensitive information only on official, secure websites.

    • Environmental Topics
    • Air
    • Bed Bugs
    • Cancer
    • Chemicals, Toxics, and Pesticide
    • Emergency Response
    • Environmental Information by Location
    • Health
    • Land, Waste, and Cleanup
    • Lead
    • Mold
    • Radon
    • Research
    • Science Topics
    • Water Topics
    • A-Z Topic Index
    • Laws & Regulations
    • By Business Sector
    • By Topic
    • Compliance
    • Enforcement
    • Laws and Executive Orders
    • Regulations
    • Report a Violation
    • Environmental Violations
    • Fraud, Waste or Abuse
    • About EPA
    • Our Mission and What We Do
    • Headquarters Offices
    • Regional Offices
    • Labs and Research Centers
    • Planning, Budget, and Results
    • Organization Chart
    • EPA History

Breadcrumb

  1. Home
  2. EPA ExpoBox
  3. Approaches

Exposure Assessment Tools by Approaches - Indirect Estimation (Scenario Evaluation)

On this page:

  • Overview
  • Scenarios
  • Sources
  • Fate and Transport
  • Concentrations
  • Populations
  • Exposure Factors
  • Calculating
  • References

Overview

Indirect Estimation
EPA’s Guidelines for Exposure Assessment (U.S. EPA, 1992) defines scenario evaluation as

"an approach to quantifying exposure by measurement or estimation of both the amount of a substance contacted, and the frequency/duration of contact, and subsequently linking these together to estimate exposure or dose."

Scenario evaluation is an “indirect estimation” method that relies on an exposure scenario to estimate exposures or doses. An exposure scenario is a set of facts, assumptions, and inferences about how exposure takes place.

This is in contrast to Point-of-Contact approaches, which more directly measure exposures or doses, and Exposure Reconstruction, which estimates exposure using information on an effect or outcome.

Indirect estimation of exposure or dose ultimately requires quantitative values to use as inputs to exposure/dose equations. The inputs to these equations are obtained through the development of exposure scenarios.

Exposure scenarios rely on data or assumptions about the sources and releases of a stressor of interest, fate and transport mechanisms, and concentrations of contaminants at the point of exposure. Information about receptor populations and exposure factors (e.g., activities and time frame over which exposure occurs) are also needed.

The general equation shown in the adjacent figure, and more complex integrative models can be used to quantify exposures or doses for the populations of interest. Point-of-Contact measurement approaches can be used to validate results of scenario evaluation assessments.

Indirect Estimation of Potential Dose: Example
Indirect estimation of potential dose diagramExposure FactorsCharacterizing PopulationsFate and TransportConcentrationsSources and ReleasesDeveloping Scenarios

Developing Scenarios

  • Planning, Scoping, and Problem Formulation
  • Exposure Setting
  • Stressors of Concern
  • Tailoring the Exposure Scenario
  • Tools

The goal of scenario evaluation is to estimate exposure or dose by establishing exposure profiles. These profiles link concentrations of a stressor in environmental media to the frequency and duration of a receptor’s contact with those media.

The organizational construct used most often to analyze the link between source and receptor is an exposure scenarioA set of facts, data, assumptions, inferences, and sometimes professional judgment about how exposure takes place.. Exposure scenarios provide a foundation that can be used by assessors as they:

  • qualitatively characterize the conditions under which exposures are expected to occur;
  • quantitatively estimate exposure, dose, and risk values;
  • provide a context for quantitative estimates to risk managers, mainly through application of appropriate exposure and risk descriptorsEstimates for a specific point on the exposure distribution (e.g., mean, median, 95th percentile, maximum) for individual or population exposures.; and
  • evaluate the relative impacts of different risk management decisions.

An exposure scenario generally contains some information on the following components:

  • Exposure Setting: The physical setting where exposure takes place.
  • Characterization of the Stressor: Identification and characterization of stressors of concern, sources and releases, and concentrations in environmental media.
  • Exposure Pathways: The pathway(s) of the stressor from source(s) to receptors(s), including its fate and transport through the environment, the routes to exposed individual(s), and the specific exposure location(s).
  • Characterization of the Exposed Population: Identification of the individual(s) or population(s) exposed, and the receptor characteristics, activities, and behaviors (i.e., the exposure factor(s) that influence the frequency and duration of contact with the stressor).
  • Intake and Uptake Rates: Exposure factor(s) that quantify the transfer of the stressor across biological boundaries.

Planning, Scoping, and Problem Formulation

Problem formulation is the process by which the assessor, in conjunction with risk managers and often various stakeholders, determines the purpose, scope, level of detail, and approach of an assessment.

According to EPA’s Guidelines for Exposure Assessment (U.S. EPA, 1992),

"In beginning the evaluation phase of any assessment, the assessor should have a scenario's basic assumptions (setting, scope, etc.) well identified, one or more applicable exposure pathways defined, an equation for evaluating the exposure or dose for each of those exposure pathways, and the data and information requirements pertinent to solving the equations."

To arrive at these basic assumptions, the assessor usually considers a set of basic questions about the factors influencing an exposure assessment. Some examples are presented below. Available information is compiled to inform the assessment. Generally, consultation with experts (e.g., statisticians, toxicologists) is necessary to address some of the questions in detail.

Planning, scoping, and problem formulation is often an iterative process. This step may be revisited throughout the course of the exposure assessment as new information is collected and preliminary results are obtained.

Planning, scoping, and problem formulation is often an iterative process and a step that will be revisited throughout the course of the exposure assessment as new information is collected and preliminary results are obtained.

Planning, scoping, and problem formulation is necessary to establish a clear purpose and scope of the assessment. It is used to characterize the exposure setting and stressors of concern in sufficient detail to allow quantitative analysis and modeling. It also helps to determine whether

  • a scenario evaluation approach is appropriate
  • which tier or type of scenario should be developed, what descriptor is most appropriate for the scenario, and
  • which routes, populations, and media should be included in the scenario

The Screening-Level and Refined Module in the Tiers and Types Tool Set of EPA ExpoBox provides additional information on the planning process and applying a tiered approach.

EPA’s Guidance on Cumulative Risk Assessment: Part 1. Planning and Scoping (1997b) notes that developing a conceptual model is a key part of the planning and scoping stage for an exposure assessment.

A conceptual model (CM) is a diagram or written description of the predicted key relationships between the predicted responses of a population (or entity of concern) and its stressors. It lays out the environmental pathways and routes of exposure in the context of the assessment.

The CM needs to distinguish between what is known or determined and what is assumed or based on default values. Also, it needs to include a discussion of uncertainties in the formulation of the assessment (U.S. EPA, 1997b).

Planning an Exposure Assessment
(adapted from U.S. EPA, 1992)
Purpose
  • Why is the study being conducted?
     
  • What questions will the study address and how will the results be used?
Scope
  • What are the bounds of the assessment?
     
    • What levels of resources are available (financial resources, human resources, time)?
       
    • Will inferences be made on a national, regional, or local scale?
       
    • Who or what is to be monitored?
       
    • Where does the study area begin and end (how broad is the exposure)?
       
    • Are there regulatory deadlines? Are there regulatory requirements?

       
  • What level of data quality is needed? How will these data be collected to meet study and quality goals?
     
    • Are there prior relevant studies?
       
    • What hazards and what media will be measured, and for which individuals, populations, or population segments will estimates of exposure and dose be developed?
       
    • Is it possible or likely that follow-up studies will be done?
Level of Detail
  • How accurate must the exposure or dose estimate be to achieve the purpose?
     
    • Can the acceptable level of uncertainty in results be identified?
       
  • How detailed must the assessment be to properly account for the biological link between exposure, dose, effect, and risk, if necessary?
Approach

Overarching approach questions:

  • How will the exposure assessment be incorporated into the risk assessment?
     
  • How will exposure, dose, and toxicity be used to evaluate risk?

Detailed approach questions:

  • How will exposure or dose be measured or estimated, and are these methods appropriate given the biological links among exposure, dose, effect, and risk?
     
  • How will populations be characterized?
     
  • How will exposure concentrations be estimated (i.e., measured or modeled)?
     
  • What is known about the environmental and biological fate of the compound?
     
  • What are the important exposure pathways?
    • Are there standard sampling methods available for those pathways?

       
  • What is known about expected concentrations, analytical methods, and detection limits?
    • Are the presently available analytical methods capable of detecting the hazard of interest and can they achieve the level of quality needed in the assessment?
       
    • How many samples are needed? When will the samples be collected? How frequently?
       
    • How will the data be handled, analyzed, and interpreted?

Several resources are available for the process of planning, scoping, and problem formation.


Exposure Setting

An exposure setting is the physical setting where an exposure of interest occurs. It is defined by the boundaries of the analysis and the scope and geographic scale of the assessment. Data are collected on physical characteristics that will affect the movement, transformation, and persistence of contaminants within the domain of the exposure scenario.

Relevant information might include data on groundwater flow, soil type, surface water characteristics, meteorological conditions, and land use/land cover types, among others, as illustrated in the graphic below.

The Exposure Setting
This figure depicts leaking drums as the source of contamination. Chemicals are released into the air via volatilization, soil via leakage, and water via leaching. The chemicals are transported through air and water to the receptor populations. Receptors also are exposed through direct contact with the soil.

Stressors of Concern

A stressor is any biological, chemical, or physical entity that can cause or induce an adverse response in a human or ecological receptor. Traditional risk assessment has used a single-stressor approach. However, some risk assessment tools and models that allow for the assessment of multiple stressors are now available. (See the Aggregate and Cumulative Module in the Tiers and Types Tool Set of EPA ExpoBox)

Databases and other resources are available that describe the occurrence and characteristics of single stressors, and classes of stressors (e.g., radiation, pesticides). Resources on stressors associated with specific scenarios (e.g., drinking water contaminants, household product ingredients) might also be of interest to assessors.

These resources generally include available data on the physicochemical properties that affect the transport, transformation, and fate of stressors in environmental media. They may also include data on properties that are relevant to the toxicological potential of the stressor. Regulatory agencies also derive exposure levels for various stressors based on human health or ecological effects, and these values can be found in a variety of databases.

Considerations involved with developing exposure scenarios for specific chemical classes are described in the Chemical Classes Tool Set of EPA ExpoBox.


Tailoring the Exposure Scenario

There are a number of ways to tailor an exposure scenario to focus on a specific tier or type of analysis, exposure route, exposed population, exposure medium, or chemical class. The methods and resources available for tailoring an exposure scenario in these different areas are described in the other Tool Sets available in EPA ExpoBox:

  • Tiers and Types. Exposure scenarios can be developed to support different tiers and types of exposure assessments. Individual "tiers" correspond to iteratively more complex, and typically data-intensive, steps in the assessment. At each stage of a tiered exposure assessment, investigators evaluate whether the assessment results are sufficient to support the risk management decisions. The type of assessment might refer to whether the assessment is considering aggregate or cumulative exposures or whether is at the individual or population level.
  • Exposure Routes. Exposure scenarios can be developed to focus on either one or many routes of exposure. The routes of exposure for which environmental exposure scenarios are commonly developed are inhalation, ingestion, and dermal contact.
  • Exposure Media. Exposure scenarios can evaluate releases of stressors to a specific media, movement within media, and potential for contact with a receptor. Typical media compartments include air, water and sediment, soil and dust, food, aquatic biota, and consumer products.
  • Exposed Populations. Exposure scenarios can be developed for one or more individuals within a population or a population as a whole. Some scenarios are developed to estimate general population exposures. Others focus on specific population segments such as residential, consumer, occupational, and highly exposed populations.

Tools


Sources and Releases

People can be exposed to stressors in the air they breathe, food they eat, water they drink, and products they use or contact. Sources of stressors can be places, objects, activities, or entities that release chemicals (e.g., automobile, pesticide application). Typically, the source is defined as the origin of an agent, or stressor, for the purposes of an exposure assessment.

When a substance is released from a source, it is subject to transport and transformation in the environment. Fate and transport processes "link" the source and release of substances with the resultant environmental concentrations to which people can be exposed.

Environmental monitoring can provide information on release rates and environmental concentrations of a stressor. It can also assist in evaluating source/stressor formation and fate and transport. Monitoring data can be used with environmental fate and transport models to characterize media-specific exposure concentrations.

Monitoring data are not always available. For some exposure assessments, data on sources and releases include quantitative information about emission rates of chemicals. These data are available in emission inventories maintained by government agencies, in facility-specific records, or via direct measurement at the site of release. Emission rates can also be estimated using emission factors.

Sources release a substance into a receiving medium (e.g., air, water). However, that initial receiving media compartment can subsequently serve as a source by releasing into other media. In other words, environmental media can serve as both sources and receiving media.

Data are collected to characterize the rate of release of agents into the environment from a source of emission such as an incinerator, landfill, industrial or municipal facility, or consumer product. Databases and other resources are available that identify common sources of stressors in the environment and quantify their releases to and from air, water, soil/sediment, food, biota, and consumer products.


Fate and Transport

Fate and transport covers movement of substances in the environment and chemical/biological reactions that affect the nature of the substance. The figure below shows some transport processes that might occur following release of a contaminant.

Transport: Movement Within and Between Environmental Media

Transport: Movement within and between Environmental Media

Transport can occur within a medium. For example, in the figure, a chemical released to the air is shown moving away from the stack via advective, dispersive, and diffusive processes. These same processes might also occur in the surface water.

Transport can also happen at the interface between two environmental media. For example, chemicals present in the air as vapors or absorbed into particles can be transferred into the soil via a range of different processes occurring at and across the air-soil interface.

Transport of chemicals can also occur between abiotic and biotic media. In other words, people and wildlife, as part of the environment, can be exposed to chemicals released initially to abiotic environmental media (Thibodeaux, 1996).

The other part of "fate and transport" is chemical transformation of a contaminant in the environment. This is typically assumed to occur within a medium. Some of the types of transformations that can occur in the environment are shown in the figure below.

Transformation: Chemical Changes within a Medium

Transformation: Chemical Changes within a Medium

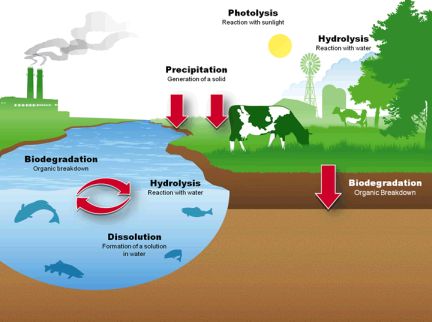
Once released into the environment, the form and distribution of stressors among various media or environmental compartments can be affected by the physical and chemical properties of the stressor (e.g., water solubility, vapor pressure, partitioning).

Characteristics of the environment can also impact fate and transport. Some categories of characteristics that can influence stressor fate and transport include:

  • Soil and sediment properties, such as particle size and porosity
     
  • Climate and meteorology, which cover properties like wind speed, evaporation rate, and rainfall amount
     
  • Surface water and groundwater properties, including flow, temperature, and pH
     
  • Other properties of the ecosystem, including microbial populations, topography, and indigenous species

The specific influences that environmental characteristics can have on stressors’ fate and transport patterns are widely varied. In exposure assessments, fate and transport of stressors is typically evaluated via some level of modeling. Modeling applies mathematical representations to the processes that distribute and transform stressors in the environment.

Resources are available that provide information on physicochemical properties that affect fate and transport. Other resources provide tools for evaluation of fate and transport based on media type.


Concentrations

As described in the EPA’s Guidelines for Exposure Assessment (U.S. EPA, 1992), exposure is dependent upon the intensity, frequency, and duration of contact. Exposure magnitude is usually expressed as the concentration of contaminant per unit mass or volume (e.g., μg/g, μg/L, mg/m3, ppm) within the environmental media to which exposure occurs.

Characterizing contaminant concentrations for an exposure scenario is typically accomplished using one or more of the following approaches:

  • Sampling the bulk media with which the receptor is expected to come into contact and analyzing the media to measure contaminant concentration
     
  • Using existing, available measured concentration data collected for related analysis or compiled in databases
     
  • Modeling the concentration distribution based on source characteristics, media transport, and chemical transformation processes (i.e., modeling fate and transport)

Methods for Determining Contaminant Concentrations

Stressor concentrations are typically measured or estimated in air, water, soil, food or food webs, microenvironments, surfaces, biota, or a combination of any of these.

Environmental concentrations or exposures can be measured directly through media sampling or monitoring and analysis, or indirectly estimated using models. A common approach for quantifying exposure for risk assessment is to combine the use of environmental monitoring data with model outputs. This approach integrates measured concentrations, and the effects of fate and transport processes.

Depending on the assessment, the modeling approach can be characterized in multiple ways including:

Mechanistic (i.e., based on theories of physical processes)
OR
Empirical (i.e., based on observed experimental data)

Deterministic (i.e., uses set of single point values)
OR
Probabilistic (i.e., uses distribution of point values from which single point values are selected randomly)

Steady-state (i.e., variables are assumed to stay the same over time)
OR
Dynamic (i.e., variables are assumed to change over time)

Further, the fate and transport processes might be modeled based on one or more of these approaches:

  • First principles – model is based only on established scientific laws and principles; no assumptions are employed.
     
  • Partitioning – model is based on how transport and transformation phenomena influence the distribution of the substance in the environment.
     
  • Mixing – model is based on identifying features in mixtures that allow stressors to be quantified by source.
     
  • Bioaccumulation – model is based on the varying abilities of biological organisms to accumulate stressors over time at concentrations higher than those to which they are exposed.

Many resources are available describing modeling techniques, sampling techniques, and analytical methods employed for estimating or measuring media concentrations in air, water and sediment, soil and dust, food, aquatic biota, and consumer products.


Characterizing Populations

Exposure can vary across populations. Differences in age, sex, dietary preferences, occupation, cultural practices, geographical locations and settings may affect exposures.Certain behaviors, activities, or sociodemographic factors may also be associated with differences in contact with environmental agents.

For example, infants might experience higher exposures to certain types of contaminants than adults because of mouthing behaviors that increase the likelihood of ingesting soil or dust. Older adults may be more affected by exposures to other types of environmental agents because of physiological differences associated with age.

Individuals living in buildings in disrepair (e.g., with peeling paint) might have higher exposure to certain types of contaminants (e.g., lead, particulate matter, vehicle exhaust) than individuals in other settings. See the Lifestages and Populations Tool Set of EPA ExpoBox for additional information and resources on assessing exposure to specific groups (e.g., tribes/ethnic populations, workers) and lifestages (e.g., children, older adults).

EPA’s Guidelines for Exposure Assessment (U.S. EPA, 1992) suggest that it is often helpful for risk assessors to characterize and quantify the magnitude of risk for specific highly exposed, highly sensitive, or highly susceptible subgroups within the larger population. Considering vulnerability and susceptibility is critical to protect those populations at greatest risk when making risk management decisions.

Identifying Highly Exposed Populations

U.S. EPA’s Sociodemographic Data Used for Identifying Potentially Highly Exposed Populations (U.S. EPA, 1999b) provides guidance to help risk and exposure assessors identify and enumerate populations that may potentially experience greater contact with environmental contaminants due to unique activity patterns, preferences, behaviors and various sociodemographic.

The tables below provide information to help assessors enumerate populations, based on a variety of population characteristics. The intent is to provide data for selected populations of concern in common potential exposure scenarios—not for every possible population group.

In some cases, these resources can be used directly to quantify a population of interest (e.g., U.S. Census Bureau data on the number of individuals in a certain age group). In other cases, the resources can be used to help characterize potential exposure for a population in a certain category (e.g., the number of homes built before 1978 might serve as a surrogate for estimating the number of people potentially exposed to lead paint).

Tools for estimating exposure among specific population groups (e.g., tribes/ethnic populations, workers) and lifestages (e.g., children, older adults) can be found in the Lifestages and Populations Tool Set of EPA ExpoBox.


Exposure Factors

Explore tthe Exposure Factors Handbook and Related Documents
Cover of the Exposure Factors Handbook (2011 Edition)

About the Exposure Factors Handbook
Search the Exposure Factors Handbook Tables
ExpoFIRST
A scientific modeling tool that pulls from the EPA's 2011 Exposure Factors Handbook.
Get ExpoFIRST!
Click to download and learn more about ExpoFIRST

Exposure factors are factors related to human behavior and characteristics that help determine an individual's exposure to an agent. These factors include, rates of ingestion (e.g., foods, soil, water) or inhalation, factors affecting dermal exposure (e.g., skin surface area, soil-to-skin adherence), activity factors (e.g., time spent indoors, time spent showering, etc.), or other factors (e.g., body weight, consumer products use).

The main source of exposure factors data is EPA’s Exposure Factors Handbook, or Handbook. Information from the Handbook and data and resources used in developing the recommendations provided in the Handbook may be accessed using the the tables provided on the About the Exposure Factors Handbook page.


Recommended values: A summary of the recommended values from the Exposure Factors Handbook: 2011 Edition and recent updates is provided in spreadsheet format (XLS)* (1 pp, 82 K). It is important to note that these recommendations are not legally binding on any U.S. EPA program and should be interpreted as suggestions that program offices or individual exposure assessors can consider and modify as needed.

*Date of last update is February 6, 2019.


EFH Tables: Tables from the 2011 Handbook and recent updates can be identified from the EPA ExpoBox's Exposure Factor Tables Search. A selected number of these tables are available in spreadsheet format. These tables were selected because they contain distributional information that may be suitable for probabilistic analyses.


EFH Data Tool:ExpoFIRST is a standalone tool that draws from data in the EPA’s Exposure Factors Handbook 2011 Edition and recent updates for quick, easy, and flexible development of human exposure scenarios. The tool develops these scenarios based on the selections made by the user in terms of the route of exposure, media, exposure descriptor, receptor (age groups) and other demographic and/or activity-related factors.


Other Resources

There are similar efforts in other countries that provide data on exposure factors. For example, the European Union developed the ExpoFacts database which contains data from 30 European countries. Likewise, Japan developed the Japanese Exposure Factors Handbook and Australia developed the Australian Exposure Factor Guide (PDF)(87 pp, 4.45 MB)  these resources provide data specific to each country’s population.

Calculating Exposure and Dose

  • Methods
  • Exposure Descriptors
  • Tools

Methods

Approaches for quantifying exposure vary depending on the level of refinement or complexity required. Directly related to the level of refinement incorporated into an assessment is whether the results of the assessment are a point estimate or a distribution of possible values.

  • Deterministic exposure assessments use point estimates (or, single values) to quantify the amount of exposure that is likely to occur for potential receptors. They produce exposure estimates that are also point estimates and can provide an estimate of central tendencyCentral tendency estimates generally represents the average or typical individual in a population, usually the mean or median of the population distribution. or high-endHigh-end estimates of exposure are generally considered to be greater than the 90th percentile of all individuals in a defined population, but less than the exposure at the highest percentile in that population. exposures within a defined population.
  • Probabilistic exposure assessment approaches use distributions of data for various parameters to generate a distribution of possible exposure estimates. Probability distributions describe the range of values (probability) that those values might occur in the given population (U.S. EPA, 2001). A widely-used approach to estimating exposure with probability distributions is the Monte Carlo simulation.
  • Aggregate exposure assessment considers combined exposures to a single chemical across multiple routes and multiple pathways. Aggregate exposure assessments often include a summation of all potential exposure pathways. This is a conservative, health-protective approach that assumes that a single person will be exposed to the chemical through all possible exposure pathways (U.S. EPA, 2002).
  • Cumulative exposure assessment is the evaluation of multiple stressors and multiple exposure pathways. The aim of this approach is to assess the overall impact on human health of multiple chemicals that act by a common mechanism of toxicity.

The Tiers and Types Tool Set provides further discussion and links to resources related to these methods.


Exposure Descriptors

Exposure descriptors are estimates for a specific point on the exposure distribution (e.g., mean, median, 95th percentile, maximum). Exposures vary due to differences among individuals, populations, spatial and temporal scales, and other factors.

According to U.S. EPA’s (2004) Example Exposure Scenarios,

"variability can be addressed by estimating exposure for the various descriptors of exposure (i.e., central tendency, high-end, or bounding) to estimate points on the distribution of exposure."

Exposure descriptors are useful when characterizing exposure and can help exposure assessors communicate with risk managers.


Total percentile of exposure diagram
Exposure Descriptors. Source: (U.S. EPA, 1992)

Bounding Estimates

Exposure scenarios can be developed to derive a bounding estimate that captures the highest possible exposure, or theoretical upper bound, for a given exposure pathway. Bounding estimates are often used to perform screening-level assessments. If the highest possible exposure is evaluated and found to be not of concern, other potential lower exposures will also not be of concern.

Upper percentile values are selected for the key input parameters to the exposure or dose equation. The combination of these assumptions results in a highly conservative exposure estimate.

The scenarios developed for bounding estimates are sometimes referred to as “worst case” scenarios in which

“everything that can plausibly happen to maximize exposure, dose, or risk does in fact happen. This worst case may occur (or even be observed) in a given population, but since it is usually a very unlikely set of circumstances, in most cases, a worst-case estimate will be somewhat higher than occurs in a specific population” (U.S. EPA, 1992)


High-End Estimates

Exposure scenarios can be developed to derive high-end estimates of exposure. These are generally considered to be more realistic or more likely to occur compared with bounding estimates. They are often calculated using a combination of high and central inputs for exposure parameters. High-end estimates of exposure are, by definition, intended to fall within the actual distribution, rather than above it. Estimates above the distribution are bounding estimates (U.S. EPA, 1992).

The following descriptors all account for individuals at the high end of the exposure distribution (at or above the 90th percentile):

  • Reasonable maximum exposure (RME) – the highest exposure reasonably likely to occur, generally assumed to be in the range of the 90th and 99.9th percentiles (U.S. EPA, 2001)
  • Reasonable worst-case exposure – the lower part of the high-end exposure range, which is above the 90th percentile but below the 98th percentile (U.S. EPA, 1992)
  • Maximum exposure – the range above the 98th percentile (U.S. EPA, 1992)

These terms all refer to exposures that are within the population distribution and not outside the distribution. The terms are expected to describe "an individual who exists, or is thought to exist, in the population." The worst-case scenario, by contrast, describes a situation of exposure that is "a statistical possibility that may or may not occur in the population" (U.S. EPA, 1992).

As the exposure estimate moves higher within the percentile range, the level of uncertainty increases. These high-end estimates are intended to assess exposures that are higher than average, but still within a realistic, reasonable anticipated range.

Central Tendency Estimates

Exposure scenarios can be developed to derive a central tendency estimate that represents the exposure of the average or typical individual in a population, usually the mean or median of the population distribution.

The arithmetic mean uses average values for all of the factors that comprise the exposure of interest. This value may not necessarily be representative of a single receptor or group, but it falls within the actual distribution and is useful for characterizing exposure for the average population. This value is sometimes called the "average estimate," but terminology varies from assessment to assessment.

The median is another useful descriptor of central tendency, especially when data on the receptor or exposure of interest are skewed as they are in a log normal distribution. This is often called the "typical case," but terminology can vary.

If both the arithmetic mean and median exposure estimates are available, but vary substantially from each other, it is useful to provide both values to risk assessors to provide greater context about the exposure scenario and resulting exposure estimates.


Tools

A variety of tools are available for calculating the doses of contaminants to which populations may be exposed. These tools have typically been developed for specific situations or programs but may be tailored to meet the needs of the user.

Also see the Routes Tool Set for information and tools on calculating dose.


References

  • Thibodeaux, LJ. (1996). Environmental Chemodynamics (2 ed.). New York: John Wiley & Sons.
  • U.S. EPA. (1992). Guidelines for Exposure Assessment. (EPA/600/Z-92/001). Washington, DC.
  • U.S. EPA. (1997a). Exposure Factors Handbook. (EPA/600/P-95/002Fa-c). Washington, DC.
  • U.S. EPA. (1997b). Guidance on Cumulative Risk Assessment, Part 1 Planning and Scoping. Washington, DC.
  • U.S. EPA. (1999a). Risk Assessment Guidance for Superfund (RAGS): Volume I - Human Health Evaluation Manual, Supplement to Part A: Community Involvement in Superfund Risk Assessments. (EPA/540-R-98-042). Washington, DC.
  • U.S. EPA. (1999b). Sociodemographic Data Used for Identifying Potentially Highly Exposed Populations. (EPA/600/R-99/060). Washington, DC.
  • U.S. EPA. (2001). Risk Assessment Guidance for Superfund: Volume III - Part A, Process for Conducting Probabilistic Risk Assessment. (EPA 540-R-02-002). Washington, DC.
  • U.S. EPA. (2002). Guidance on Cumulative Risk Assessment of Pesticide Chemicals that have a Common Mechanism of Toxicity. Washington, DC.
  • U.S. EPA. (2004). Example Exposure Scenarios Assessment Tool. (EPA 600/R03/036). Washington, DC.
  • U.S. EPA. (2008). Child-Specific Exposure Factors Handbook. (EPA/600/R-06/096F). Washington, DC.
  • U.S. EPA. (2009). Highlights of the Child-Specific Exposure Factors Handbook. (EPA/600/R-08/135). Washington, DC.
  • U.S. EPA. (2011a). Exposure Factors Handbook: 2011 Edition (EPA/600/R-09/052F). Washington, DC.
  • U.S. EPA. (2011b). Highlights of the Exposure Factors Handbook. (EPA/600/R-10/030). Washington, DC.

Spreadsheets

Source: Exposure Factors Handbook released on October 3, 2011.
All files are in MS Excel format.

Download all tables in this chapter (.xlsx, 136K)

  • Table 6–4 Distribution Percentiles of Physiological Daily Inhalation Rates (PDIRs) (m3/day) for Free Living Normal Weight Males and Females Aged 2.6 Months to 96 Years (.xls, 29K)
  • Table 6–6 Distribution Percentiles of Physiological Daily Inhalation Rates (PDIRs) (m3/day) for Free Living Normal Weight and Overweight/Obese Males and Females Aged 4 to 96 Years (.xls, 30K)
  • Table 6–7 Distribution Percentiles of Physiological Daily Inhalation Rates (PDIRs) per Unit of Body Weight (m3/kg day) for Free Living Normal Weight Males and Females Aged 2.6 Months to 96 Years (.xls, 27K)
  • Table 6–8 Distribution Percentiles of Physiological Daily Inhalation Rates (PDIRs) (m3/kg day) for Free Living Normal Weight and Overweight/Obese Males and Females Aged 4 to 96 Years (.xls, 28K)
  • Table 6–10 Non-Normalized Daily Inhalation Rates (m3/day) Derived Using Layton’s (1993) Method and CSFII Energy Intake Data (.xls, 28K)
  • Table 6–14 Descriptive Statistics for Daily Average Inhalation Rate in Males, by Age Category (.xls, 27K)
  • Table 6–15 Descriptive Statistics for Daily Average Inhalation Rate in Females, by Age Category (.xls, 28K)
  • Table 6–17 Descriptive Statistics for Average Ventilation Rate, Unadjusted for Body Weight, While Performing Activities Within the Specified Activity Category, for Males by Age Category (.xls, 47K)
  • Table 6–18 Descriptive Statistics for Average Ventilation Rate, Adjusted for Body Weight, While Performing Activities Within the Specified Activity Category, for Males by Age Category (.xls, 46K)
  • Table 6–19 Descriptive Statistics for Average Ventilation Rate, Unadjusted for Body Weight, While Performing Activities Within the Specified Activity Category, for Females by Age Category (.xls, 46K)
  • Table 6–20 Descriptive Statistics for Average Ventilation Rate, Adjusted for Body Weight, While Performing Activities Within the Specified Activity Category, for Females by Age Category (.xls, 45K)
  • Table 6–21 Descriptive Statistics for Duration of Time (hours/day) Spent Performing Activities Within the Specified Activity Category, by Age for Males (.xls, 32K)
  • Table 6–22 Descriptive Statistics for Duration of Time (hours/day) Spent Performing Activities Within the Specified Activity Category, by Age for Females (.xls, 32K)
  • Table 6–37 Distribution of Predicted Inhalation Rates by Location and Activity Levels for Elementary and High School Students (.xls, 27K)
  • Table 6–39 Distribution Patterns of Daily Inhalation Rates (DIRs) for Elementary (EL) and High School (HS) Students Grouped by Activity Level (.xls, 25K)
  • Table 6–50 Distributions of Individual and Group Inhalation/Ventilation Rate (VR) for Outdoor Workers (.xls, 24K)
  • Table 6–53 Distribution of Physiological Daily Inhalation Rate (PDIR) (m3/day) Percentiles for Free Living Underweighta Adolescents and Women Aged 11 to 55 Years During Pregnancy and Postpartum Weeks (.xls, 28K)
  • Table 6–54 Distribution of Physiological Daily Inhalation Rate (PDIR) (m3/day) Percentiles for Free Living Normal Weighta Adolescents and Women Aged 11 to 55 Years During Pregnancy and Postpartum Weeks (.xls, 28K)
  • Table 6–55 Distribution of Physiological Daily Inhalation Rate (PDIR) (m3/day) Percentiles for Free Living Overweight/Obesea Adolescents and Women Aged 11 to 55 Years During Pregnancy and Postpartum Weeks (.xls, 28K)
  • Table 6–56 Distribution of Physiological Daily Inhalation Rate (PDIR) (m3/kg day) Percentiles for Free Living Underweight Adolescents and Women Aged 11 to 55 Years During Pregnancy and Postpartum Weeks (.xls, 30K)
  • Table 6–57 Distribution of Physiological Daily Inhalation Rate (PDIR) (m3/kg day) Percentiles for Free Living Normal Weight and Women Aged 11 to 55 Years During Pregnancy and Postpartum Weeks (.xls, 30K)
  • Table 6–58 Distribution of Physiological Daily Inhalation Rate (PDIR) (m3/kg day) Percentiles for Free Living Overweight/Obesea Adolescents and Women Aged 11 to 55 Years During Pregnancy and Postpartum Weeks (.xls, 30K)

Inhalation - Related Links

  • National Health and Nutritional Examination Survey (NHANES) conducted by the CDC, is an ongoing program of studies designed to collect information about the health and nutritional status of the US population. Data collection includes information on body mass index.

Spreadsheets

Source: Exposure Factors Handbook released on October 3, 2011.
All files are in MS Excel format.

Download all tables in this chapter (.xlsx, 139K)

  • Table 3–7 Per Capita Estimates of Combined Direct and Indirect Water Ingestion Based on 1994–1996, 1998 CSFII: Community Water (mL/day) (.xls, 26K)
  • Table 3–8 Per Capita Estimates of Combined Direct and Indirect Water Ingestion Based on 1994–1996, 1998 CSFII: Bottled Water (mL/day) (.xls, 26K)
  • Table 3–9 Per Capita Estimates of Combined Direct and Indirect Water Ingestion Based on 1994–1996, 1998 CSFII: Other Sources (mL/day) (.xls, 26K)
  • Table 3–10 Per Capita Estimates of Combined Direct and Indirect Water Ingestion Based on 1994–1996, 1998 CSFII: All Sources (mL/day) (.xls, 26K)
  • Table 3–11 Per Capita Estimates of Combined Direct and Indirect Water Ingestion Based on 1994–1996, 1998 CSFII: Community Water (mL/kg-day) (.xls, 26K)
  • Table 3–12 Per Capita Estimates of Combined Direct and Indirect Water Ingestion Based on 1994–1996, 1998 CSFII: Bottled Water (mL/kg-day) (.xls, 25K)
  • Table 3–13 Per Capita Estimates of Combined Direct and Indirect Water Ingestion Based on 1994–1996, 1998 CSFII: Other Sources (mL/kg-day) (.xls, 26K)
  • Table 3–14 Per Capita Estimates of Combined Direct and Indirect Water Ingestion Based on 1994–1996, 1998 CSFII: All Sources (mL/kg-day) (.xls, 26K)
  • Table 3–15 Consumer-Only Estimates of Combined Direct and Indirect Water Ingestion Based on 1994–1996, 1998 CSFII: Community Water (mL/day) (.xls, 25K)
  • Table 3–16 Consumer-Only Estimates of Combined Direct and Indirect Water Ingestion Based on 1994–1996, 1998 CSFII: Bottled Water (mL/day) (.xls, 26K)
  • Table 3–17 Consumer-Only Estimates of Combined Direct and Indirect Water Ingestion Based on 1994–1996, 1998 CSFII: Other Sources (mL/day) (.xls, 26K)
  • Table 3–18 Consumer-Only Estimates of Combined Direct and Indirect Water Ingestion Based on 1994–1996, 1998 CSFII: All Sources (mL/day) (.xls, 25K)
  • Table 3–19 Consumer-Only Estimates of Direct and Indirect Water Ingestion Based on 1994–1996, 1998 CSFII: Community Water (mL/kg-day) (.xls, 25K)
  • Table 3–20 Consumer-Only Estimates of Direct and Indirect Water Ingestion Based on 1994–1996, 1998 CSFII: Bottled Water (mL/kg-day) (.xls, 26K)
  • Table 3–21 Consumer-Only Estimates of Direct and Indirect Water Ingestion Based on 1994–1996, 1998 CSFII: Other Sources (mL/kg-day) (.xls, 26K)
  • Table 3–22 Consumer-Only Estimates of Direct and Indirect Water Ingestion Based on 1994–1996, 1998 CSFII: All Sources (mL/kg-day) (.xls, 25K)
  • Table 3–23 Per Capita Estimates of Combined Direct and Indirect Water Ingestion Based on NHANES 2003–2006: Community Water (mL/day) (.xls, 25K)
  • Table 3–24 Per Capita Estimates of Combined Direct Water Ingestion Based on NHANES 2003–2006: Bottled Water (mL/day) (.xls, 25K)
  • Table 3–25 Per Capita Estimates of Combined Direct and Indirect Water Ingestion Based on NHANES 2003–2006: Other Sources (mL/day) (.xls, 25K)
  • Table 3–26 Per Capita Estimates of Combined Direct and Indirect Water Ingestion Based on NHANES 2003–2006: All Sources (mL/day) (.xls, 25K)
  • Table 3–28 Per Capita Estimates of Combined Direct and Indirect Water Ingestion Based on NHANES 2003–2006: Community Water (mL/kg-day) (.xls, 25K)
  • Table 3–29 Per Capita Estimates of Combined Direct Water Ingestion Based on NHANES 2003–2006: Bottled Water (mL/kg-day) (.xls, 25K)
  • Table 3–30 Per Capita Estimates of Combined Direct and Indirect Water Ingestion Based on NHANES 2003–2006: Other Sources (mL/kg-day) (.xls, 25K)
  • Table 3–31 Per Capita Estimates of Combined Direct and Indirect Water Ingestion Based on NHANES 2003–2006: All Sources (mL/kg-day) (.xls, 27K)
  • Table 3–33 Consumer-Only Estimates of Combined Direct and Indirect Water Ingestion Based on NHANES 2003–2006: Community Water (mL/day) (.xls, 24K)
  • Table 3–34 Consumer-Only Estimates of Combined Direct and Indirect Water Ingestion Based on NHANES 2003–2006: Bottled Water (mL/day) (.xls, 24K)
  • Table 3–35 Consumer-Only Estimates of Combined Direct and Indirect Water Ingestion Based on NHANES 2003–2006: Other Sources (mL/day) (.xls, 25K)
  • Table 3–36 Consumer-Only Estimates of Combined Direct and Indirect Water Ingestion Based on NHANES 2003–2006: All Sources (mL/day) (.xls, 25K)
  • Table 3–38 Consumer-Only Estimates of Direct and Indirect Water Ingestion Based on NHANES 2003–2006: Community Water (mL/kg-day) (.xls, 25K)
  • Table 3–39 Consumer-Only Estimates of Direct Water Ingestion Based on NHANES 2003–2006: Bottled Water (mL/kg-day) (.xls, 25K)
  • Table 3–40 Consumer-Only Estimates of Direct and Indirect Water Ingestion Based on NHANES 2003–2006: Other Sources (mL/kg-day) (.xls, 25K)
  • Table 3–41 Consumer-Only Estimates of Direct and Indirect Water Ingestion Based on NHANES 2003–2006: All Sources (mL/kg-day) (.xls, 25K)
  • Table 3–75 Per Capita Estimates of Direct and Indirect Water Intake From All Sources by Pregnant, Lactating, and Childbearing Age Women (mL/kg-day) (.xls, 25K)
  • Table 3–76 Per Capita Estimates of Direct and Indirect Water Intake From All Sources by Pregnant, Lactating, and Childbearing Age Women (mL/day) (.xls, 25K)
  • Table 3–77 Per Capita Estimated Direct and Indirect Community Water Ingestion by Pregnant, Lactating, and Childbearing Age Women (mL/kg-day) (.xls, 24K)
  • Table 3–78 Per Capita Estimated Direct and Indirect Community Water Ingestion by Pregnant, Lactating, and Childbearing Age Women (mL/day) (.xls, 25K)
  • Table 3–79 Estimates of Consumers-Only Direct and Indirect Water Intake From All Sources by Pregnant, Lactating, and Childbearing Age Women (mL/kg-day) (.xls, 24K)
  • Table 3–80 Estimates of Consumers-Only Direct and Indirect Water Intake From All Sources by Pregnant, Lactating, and Childbearing Age Women (mL/day) (.xls, 25K)
  • Table 3–81 Consumers-Only Estimated Direct and Indirect Community Water Ingestion by Pregnant, Lactating, and Childbearing Age Women (mL/kg-day) (.xls, 25K)
  • Table 3–82 Consumers-Only Estimated Direct and Indirect Community Water Ingestion by Pregnant, Lactating, and Childbearing Age Women (mL/day) (.xls, 24K)

Water Ingestion - Related Links

  • Food and nutrient intakes by individuals in the United States, 1 day, 1989-91. United States Department of Agriculture, Agricultural Research Service, Beltsville, MD. NFS Report No. 91-2, 1995. This report provides summary information on food and nutrient intake rates from more than 15,000 individuals who participated in the 1989-1991 CSFII, conducted by the USDA. The data were collected based on 1-dat dietary recall and are tabulated by age, sex, race, and other demographic characteristics.
  • Continuing Survey of Food Intake by Individuals (CSFII) 1994-96, 1998 CD-ROM. The dataset includes information from all individuals who participated in the Continuing Survey of Food Intakes by Individuals (CSFII) in 1994-96 and 1998 and the Diet and Health Knowledge Survey (DHKS) in 1994-96. This release also includes the Technical Support Databases for CSFII 1994-96, 1998 (food codes, nutrient values, and recipes).
  • National Health and Nutritional Examination Survey (NHANES) conducted by the CDC, is an ongoing program of studies designed to collect information about the health and nutritional status of the US population. Data collection includes information on food and water intake over 2 non-consecutive days.
  • Food Commodity Intake Database (FCID). EPA's Office of Pesticide Programs developed the Food Commodity Intake Database (FCID) by converting NHANES data on the foods people reported eating to the quantities of agricultural commodities eaten, including water that was added in the preparation of foods and beverages.
  • Joint Institute for Food Safety and Applied Nutrition (JIFSAN) is a partnership between the United States Food and Drug Administration (FDA) and the University of Maryland to ensure the safety of the food supply. JIFSAN houses EPA's Food Commodity Intake Database.
  • EPA's local drinking water quality reports

Spreadsheets

Source: Exposure Factors Handbook released on October 3, 2011.
All files are in MS Excel format.

Download all tables in this chapter (.xlsx, 44K)

  • Table 4–3 New Jersey Children's Mouthing Frequency (contacts/hour) from Video-Transcription (.xls, 21K)
  • Table 4–8 Outdoor Mouthing Frequency (contacts per contacts/hour), Video-Transcription of 38 Children, by Age (.xls, 24K)
  • Table 4–10 Indoor Hand-to-Mouth Frequency (contacts/hour) Weibull Distributions from Various Studies, by Age (.xls, 24K)
  • Table 4–11 Outdoor Hand-to-Mouth Frequency (contacts/hour) Weibull Distributions From Various Studies, by Age (.xls, 23K)
  • Table 4–12 Object/Surface-to-Mouth Contact Frequency for Infants and Toddlers (events/hour) (N = 23) (.xls, 27K)
  • Table 4–13 Distributions Mouthing Frequency and Duration for Non-Dietary Objects With Significant Differences (p < 0.05) Between Infants and Toddlers (.xls, 27K)
  • Table 4–14 Indoor Object-to-Mouth Frequency (contacts/hour) Weibull Distributions From Various Studies, by Age (.xls, 24K)
  • Table 4–15 Outdoor Object-to-Mouth Frequency (contacts/hour) Weibull Distributions from Various Studies, by Age (.xls, 24K)
  • Table 4–20 Estimates of Mouthing Time for Various Objects for Infants and Toddlers (minutes/hour), by Age (.xls, 27K)
  • Table 4–21 Object/Surface-to-Hands and Mouth Contact Duration for Infants and Toddlers (minutes/hour) (N = 23) (.xls, 25K)
  • Table 4–24 Outdoor Median Mouthing Duration (seconds/contact), Video-Transcription of 38 Children, by Age (.xls, 24K)
  • Table 4–26 Outdoor Mouthing Duration (minutes/hour), Video-Transcription of 38 Children, by Age (.xls, 24K)

Non-Dietary Ingestion - Related Links

  • Standard Operating Procedures (SOPs) for Residential Exposure Assessments. This document provides standard default methods for developing residential exposure assessments for both handler and postapplication exposures to pesticides when chemical- and/or site-specific field data are limited.
  • EPA's Soil ingestion colloquium provides a discussion about issues related to soil and dust ingestion rates. Battelle (2005). Summary report of the U.S. EPA colloquium on soil/dust ingestion rates and mouthing behavior for children and adults. EPA Contract Number EP-C-04-027
  • Nestle conducts a Feeding Infants and Toddlers Study (FITS) to understand foods eaten by children at various stages of development.

Spreadsheets

Source: Exposure Factors Handbook released on October 3, 2011.
All files are in MS Excel format.

Download all tables in this chapter (.xlsx, 27K)

  • Table 5–3 Soil, Dust, and Soil + Dust Ingestion Estimates for Amherst, Massachusetts Study Children (.xls, 25K)
  • Table 5–8 Soil Ingestion Estimates for 64 Anaconda Children (.xls, 24K)
  • Table 5–11 Mean and Median Soil Ingestion (mg/day) by Family Member (.xls, 24K)
  • Table 5–14 Predicted Soil and Dust Ingestion Rates for Children Age 3 to <6 Years (mg/day) (.xls, 22K)
  • Table 5–20 Estimated Distribution of Individual Mean Daily Soil Ingestion Based on Data for 64 Subjects Projected over 365 Days (.xls, 21K)

Soil and Dust Ingestion - Related Links

  • Stochastic human exposure and dose simulation (SHEDS) model. SHEDS is a model that may be used to estimate aggregate residential exposure using probabilistic techniques that incorporate time-activity data.
  • Integrated Exposure Uptake Biokinetic (IEUBK)Model. The IEUBK model is a biokinetic model for predicting blood lead levels from measurements of lead content in environmental media (e.g., house dust, soil, drinking water, food, and air. It also provides estimates of lead intake for each exposure medium.
  • National Health and Nutritional Examination Survey (NHANES) conducted by the CDC, is an ongoing program of studies designed to collect information about the health and nutritional status of the US population. Data collection from older NHANES surveys includes information on prevalence of ingesting non-food items.
  • EPA's Soil ingestion colloquium report provides a discussion about issues related to soil and dust ingestion rates and mouthing behavior. Battelle (2005). Summary report of the U.S. EPA colloquium on soil/dust ingestion rates and mouthing behavior for children and adults. EPA Contract Number EP-C-04-027

Spreadsheets

Source: Exposure Factors Handbook released on October 3, 2011.
All files are in MS Excel format.

Download all tables in this chapter (.xlsx, 19K)

  • Table 9–3 Per Capita Intake of Fruits and Vegetables Based on the 2003–2006 NHANES (g/kg-day, edible portion, uncooked weight) (.xls, 28K)
  • Table 9–4 Consumer-Only Intake of Fruits and Vegetables Based on the 2003–2006 NHANES (g/kg-day, edible portion, uncooked weight) (.xls, 28K)

Fruit and Vegetable Intake - Related Links

  • Dietary Exposure Evaluation Model and Food Commodity Intake Database (DEEM-FCIDTM). EPA's Dietary Exposure Evaluation Model and Food Commodity Intake Database (DEEM-FCIDTM) is a dietary exposure model for estimating exposure to pesticides in foods in the diets of the U.S. population. The software incorporates food consumption data from the National Health and Nutrition Examination Survey (NHANES) conducted in 2003-2006.
  • National Health and Nutritional Examination Survey (NHANES), conducted by the CDC, is an ongoing program of studies designed to collect information about the health and nutritional status of the US population. Data collection includes information on food and water intake over 2 non-consecutive days.
  • Continuing Survey of Food Intake by Individuals (CSFII) 1994-96, 1998 CD-ROM. The dataset includes information from all individuals who participated in the Continuing Survey of Food Intakes by Individuals (CSFII) in 1994-96 and 1998 and the Diet and Health Knowledge Survey (DHKS) in 1994-96. This release also includes the Technical Support Databases for CSFII 1994-96, 1998 (food codes, nutrient values, and recipes).
  • Food Commodity Intake Database (FCID). EPA's Office of Pesticide Programs developed the Food Commodity Intake Database (FCID) by converting NHANES data on the foods people reported eating to the quantities of agricultural commodities eaten, including water that was added in the preparation of foods and beverages.
  • Joint Institute for Food Safety and Applied Nutrition (JIFSAN) is a partnership between the United States Food and Drug Administration (FDA) and the University of Maryland to ensure the safety of the food supply. JIFSAN houses EPA's Food Commodity Intake Database.

Spreadsheets

Source: Exposure Factors Handbook released on October 3, 2011.
All files are in MS Excel format.

Download all tables in this chapter (.xlsx, 315K)

  • Table 10–7 Per Capita Intake of Finfish (g/kg-day), Edible Portion, Uncooked Fish Weight (.xls, 27K)
  • Table 10–8 Consumer-Only Intake of Finfish (g/kg-day), Edible Portion, Uncooked Fish Weight (.xls, 27K)
  • Table 10–9 Per Capita Intake of Shellfish (g/kg-day), Edible Portion, Uncooked Fish Weight (.xls, 27K)
  • Table 10–10 Consumer-Only Intake of Shellfish (g/kg-day), Edible Portion, Uncooked Fish Weight (.xls, 27K)
  • Table 10–11 Per Capita Intake of Total Finfish and Shellfish Combined (g/kg-day), Edible Portion, Uncooked Fish Weight (.xls, 27K)
  • Table 10–12 Consumer-Only Intake of Total Finfish and Shellfish Combined (g/kg-day), Edible Portion, Uncooked Fish Weight (.xls, 27K)
  • Table 10–29 Per Capita Distributions of Fish (finfish and shellfish) Intake (g/day), as Prepared (.xls, 36K)
  • Table 10–30 Per Capita Distribution of Fish (finfish and shellfish) Intake (mg/kg-day), as Prepared (.xls, 34K)
  • Table 10–31 Per Capita Distribution of Fish (finfish and shellfish) Intake (g/day), Uncooked Fish Weight (.xls, 36K)
  • Table 10–32 Per Capita Distribution of Fish (finfish and shellfish) Intake (mg/kg-day), Uncooked Fish Weight (.xls, 35K)
  • Table 10–33 Consumer-Only Distribution of Fish (finfish and shellfish) Intake (g/day), as Prepared (.xls, 35K)
  • Table 10–34 Consumer-Only Distributions of Fish (finfish and shellfish) Intake (mg/kg-day), as Prepared (.xls, 33K)
  • Table 10–35 Consumer-Only Distributions of Fish (finfish and shellfish) Intake (g/day), Uncooked Fish Weight (.xls, 34K)
  • Table 10–36 Consumer-Only Distributions of Fish (finfish and shellfish) Intake (mg/kg-day), Uncooked Fish Weight (.xls, 5K)
  • Table 10–37 Fish Consumption per kg Body Weight, All Respondents, by Selected Demographic Characteristics (g/kg-day, as-consumed) (.xls, 37K)
  • Table 10–38 Fish Consumption per kg Body Weight, Consumers Only, by Selected Demographic Characteristics (g/kg-day, as-consumed) (.xls, 38K)
  • Table 10–39 Fish Consumption per kg Body Weight, All Respondents by State, Acquisition Method, (g/kg-day, as-consumed) (.xls, 32K)
  • Table 10–40 Fish Consumption per kg Body Weight, Consumers Only, by State, Acquisition Method (g/kg-day, as-consumed) (.xls, 36K)
  • Table 10–41 Fish Consumption per kg Body Weight, All Respondents, by Selected Demographic Characteristics, Uncooked (g/kg-day) (.xls, 37K)
  • Table 10–42 Fish Consumption per kg Body Weight, Consumers Only, by Selected Demographic Characteristics, Uncooked (g/kg-day) (.xls, 37K)
  • Table 10–43 Fish Consumption per kg Body Weight, All Respondents, by State, Acquisition Method, Uncooked (g/kg-day) (.xls, 32K)
  • Table 10–44 Fish Consumption per kg Body Weight, Consumers Only, by State, Acquisition Method, Uncooked (g/kg-day) (.xls, 42K)
  • Table 10–45 Fish Consumption per kg Body Weight, All Respondents, by State, Subpopulation, and Sex (g/kg-day, as-consumed) (.xls, 34K)
  • Table 10–46 Fish Consumption per kg, Consumers Only, by State, Subpopulation, and Sex (g/kg-day, as-consumed) (.xls, 35K)
  • Table 10–47 Fish Consumption Among General Population in Four States, Consumers Only (g/kg-day, as-consumed) (.xls, 32K)
  • Table 10–64 Fish Intake Rates of Members of the Laotian Community of West Contra Costa County, California (.xls, 24K)
  • Table 10–65 Consumption Rates (g/day) Among Recent Consumers by Demographic Factor (.xls, 26K)
  • Table 10–67 Consumption Rates (g/day) for Marine Recreational Anglers in King County, Wa (.xls, 24K)
  • Table 10–68 Percentile and Mean Intake Rates for Wisconsin Sport Anglers (all respondents) (.xls, 22K)
  • Table 10–71 Distribution of Usual Fish Intake Among Survey Main Respondents Who Fished and Consumed Recreationally Caught Fish (.xls, 24K)
  • Table 10–72 Estimates of Fish Intake Rates of Licensed Sport Anglers in Maine During the 1989–1990 Ice Fishing or 1990 Open-Water Seasons (.xls, 25K)
  • Table 10–82 Fish Consumption Rates for Indiana Anglers—Mail Survey (g/day) (.xls, 23K)
  • Table 10–83 Fish Consumption Rates for Indiana Anglers—On-Site Survey (g/day) (.xls, 24K)
  • Table 10–84 Consumption of Sport-Caught and Purchased Fish by Minnesota and North Dakota Residents (g/day) (.xls, 30K)
  • Table 10–86 Daily Consumption of Wild-Caught Fish, Consumers Only (g/kg-day, as-consumed) (.xls, 24K)
  • Table 10–87 Consumption Rates (g/day) for Freshwater Recreational Anglers in King County, WA (.xls, 23K)
  • Table 10–90 Fish Consumption Rates Among Native American Children (age 5 years and under) (.xls, 22K)
  • Table 10–97 Percentiles and Mean of Adult Tribal Member Consumption Rates (g/kg-day) (.xls, 28K)
  • Table 10–100 Percentiles of Adult Consumption Rates by Age (g/kg-day) (.xls, 25K)
  • Table 10–103 Adult Consumption Rate (g/kg-day): Individual Finfish and Shellfish and Fish Groups (.xls, 29K)
  • Table 10–105 Adult Consumption Rate (g/kg-day) by Sex (.xls, 30K)
  • Table 10–106 Adult Consumption Rate (g/kg-day) by Age (.xls, 33K)
  • Table 10–107 Consumption Rates for Native American Children (g/kg-day), All Children (including non-consumers): Individual Finfish and Shellfish and Fish Groups (.xls, 30K)
  • Table 10–109 Percentiles and Mean of Consumption Rates for Adult Consumers Only (g/kg-day) (.xls, 27K)
  • Table 10–110 Percentiles and Mean of Consumption Rates by Sex for Adult Consumers Only (g/kg-day) (.xls, 31K)
  • Table 10–111 Percentiles and Mean of Consumption Rates by Age for Adult Consumers Only—Squaxin Island Tribe (g/kg-day) (.xls, 30K)
  • Table 10–112 Percentiles and Mean of Consumption Rates by Age for Adult Consumers Only—Tulalip Tribe (g/kg-day) (.xls, 29K)
  • Table 10–113 Percentiles and Mean of Consumption Rates for Child Consumers Only (g/kg-day) (.xls, 25K)
  • Table 10–114 Percentiles and Mean of Consumption Rates by Sex for Child Consumers Only (g/kg-day) (.xls, 28K)
  • Table 10–121 Distribution of Quantity of Fish Consumed (in grams) per Eating Occasion, by Age and Sex (.xls, 24K)
  • Table 10–122 Distribution of Quantity of Canned Tuna Consumed (grams) per Eating Occasion, by Age and Sex (.xls, 26K)
  • Table 10–123 Distribution of Quantity of Other Finfish Consumed (grams) per Eating Occasion, by Age and Sex (.xls, 25K)

Fish and Shellfish Intake - Related Links

  • National Health and Nutritional Examination Survey (NHANES) conducted by the CDC, is an ongoing program of studies designed to collect information about the health and nutritional status of the US population. Data collection includes information on food and water intake over 2 non-consecutive days.
  • Continuing Survey of Food Intake by Individuals (CSFII) 1994-96, 1998 CD-ROM. The dataset includes information from all individuals who participated in the Continuing Survey of Food Intakes by Individuals (CSFII) in 1994-96 and 1998 and the Diet and Health Knowledge Survey (DHKS) in 1994-96. This release also includes the Technical Support Databases for CSFII 1994-96, 1998 (food codes, nutrient values, and recipes).
  • Food Commodity Intake Database (FCID). EPA's Office of Pesticide Programs developed the Food Commodity Intake Database (FCID) by converting NHANES data on the foods people reported eating to the quantities of agricultural commodities eaten, including water that was added in the preparation of foods and beverages.
  • Joint Institute for Food Safety and Applied Nutrition (JIFSAN) is a partnership between the United States Food and Drug Administration (FDA) and the University of Maryland to ensure the safety of the food supply. JIFSAN houses EPA's Food Commodity Intake Database.

Spreadsheets

Source: Exposure Factors Handbook released on October 3, 2011.
All files are in MS Excel format.

Download all tables in this chapter (.xlsx, 47K)

  • Table 11–3 Per Capita Intake of Total Meat and Total Dairy Products Based on 2003–2006 NHANES (g/kg day, edible portion, uncooked weight) (.xls, 28K)
  • Table 11–4 Consumer-Only Intake of Total Meat and Total Dairy Products Based on 2003–2006 NHANES (g/kg day, edible portion, uncooked weight) (.xls, 28K)
  • Table 11–30 Per Capita Total Fat Intake (g/day) (.xls, 30K)
  • Table 11–31 Per Capita Total Fat Intake (g/kg day) (.xls, 31K)
  • Table 11–32 Consumer-Only Total Fat Intake (g/day) (.xls, 29K)
  • Table 11–33 Consumer-Only Total Fat Intake (g/kg day) (.xls, 31K)

Meat, Dairy and Fat Intake - Related Links

  • Dietary Exposure Evaluation Model and Food Commodity Intake Database (DEEM-FCIDTM). EPA's Dietary Exposure Evaluation Model and Food Commodity Intake Database (DEEM-FCIDTM) is a dietary exposure model for estimating exposure to pesticides in foods in the diets of the U.S. population. The software incorporates food consumption data from the National Health and Nutrition Examination Survey (NHANES) conducted in 2003-2006.
  • National Health and Nutritional Examination Survey (NHANES) conducted by the CDC, is an ongoing program of studies designed to collect information about the health and nutritional status of the US population. Data collection includes information on food and water intake over 2 non-consecutive days.
  • Continuing Survey of Food Intake by Individuals (CSFII) 1994-96, 1998 CD-ROM. The dataset includes information from all individuals who participated in the Continuing Survey of Food Intakes by Individuals (CSFII) in 1994-96 and 1998 and the Diet and Health Knowledge Survey (DHKS) in 1994-96. This release also includes the Technical Support Databases for CSFII 1994-96, 1998 (food codes, nutrient values, and recipes).
  • Food Commodity Intake Database (FCID). EPA's Office of Pesticide Programs developed the Food Commodity Intake Database (FCID) by converting NHANES data on the foods people reported eating to the quantities of agricultural commodities eaten, including water that was added in the preparation of foods and beverages.
  • Joint Institute for Food Safety and Applied Nutrition (JIFSAN) is a partnership between the United States Food and Drug Administration (FDA) and the University of Maryland to ensure the safety of the food supply. JIFSAN houses EPA's Food Commodity Intake Database.

Spreadsheets

Source: Exposure Factors Handbook released on October 3, 2011.
All files are in MS Excel format.

Download all tables in this chapter (.xlsx, 16K)

  • Table 12–3 Per Capita Intake of Total Grains Based 2003–2006 NHANES (g/kg-day, edible portion, uncooked weight) (.xls, 25K)
  • Table 12–4 Consumer-Only Intake of Total Grains Based 2003–2006 NHANES (g/kg-day, edible portion, uncooked weight) (.xls, 25K)

Grain Intake - Related Links

  • Dietary Exposure Evaluation Model and Food Commodity Intake Database (DEEM-FCIDTM). EPA's Dietary Exposure Evaluation Model and Food Commodity Intake Database (DEEM-FCIDTM) is a dietary exposure model for estimating exposure to pesticides in foods in the diets of the U.S. population. The software incorporates food consumption data from the National Health and Nutrition Examination Survey (NHANES) conducted in 2003-2006.
  • National Health and Nutritional Examination Survey (NHANES), conducted by the CDC, is an ongoing program of studies designed to collect information about the health and nutritional status of the US population. Data collection includes information on food and water intake over 2 non-consecutive days.
  • Continuing Survey of Food Intake by Individuals (CSFII) 1994-96, 1998 CD-ROM. The dataset includes information from all individuals who participated in the Continuing Survey of Food Intakes by Individuals (CSFII) in 1994-96 and 1998 and the Diet and Health Knowledge Survey (DHKS) in 1994-96. This release also includes the Technical Support Databases for CSFII 1994-96, 1998 (food codes, nutrient values, and recipes).
  • Food Commodity Intake Database (FCID). EPA's Office of Pesticide Programs developed the Food Commodity Intake Database (FCID) by converting NHANES data on the foods people reported eating to the quantities of agricultural commodities eaten, including water that was added in the preparation of foods and beverages.
  • Joint Institute for Food Safety and Applied Nutrition (JIFSAN) is a partnership between the United States Food and Drug Administration (FDA) and the University of Maryland to ensure the safety of the food supply. JIFSAN houses EPA's Food Commodity Intake Database.

Spreadsheets

Source: Exposure Factors Handbook released on October 3, 2011.
All files are in MS Excel format.

Download all tables in this chapter (.xlsx, 228K)

  • Table 13–5 Consumer-Only Intake of Home-Produced Fruits (g/kg-day)—All Regions Combined (.xls, 27K)
  • Table 13–10 Consumer-Only Intake of Home-Produced Vegetables (g/kg-day)—All Regions Combined (.xls, 26K)
  • Table 13–15 Consumer-Only Intake of Home-Produced Meats (g/kg-day)—All Regions Combined (.xls, 28K)
  • Table 13–20 Consumer-Only Intake of Home-Caught Fish (g/kg-day)—All Regions Combined (.xls, 28K)
  • Table 13–25 Consumer-Only Intake of Home-Produced Dairy (g/kg-day)—All Regions (.xls, 27K)
  • Table 13–30 Seasonally Adjusted Consumer-Only Home-Produced Intake (g/kg-day) (.xls, 24K)
  • Table 13–31 Consumer-Only Intake of Home-Produced Apples (g/kg-day) (.xls, 29K)
  • Table 13–32 Consumer-Only Intake of Home-Produced Asparagus (g/kg-day) (.xls, 29K)
  • Table 13–33 Consumer-Only Intake of Home-Produced Beef (g/kg-day) (.xls, 30K)
  • Table 13–34 Consumer-Only Intake of Home-Produced Beets (g/kg-day) (.xls, 29K)
  • Table 13–35 Consumer-Only Intake of Home-Produced Broccoli (g/kg-day) (.xls, 28K)
  • Table 13–36 Consumer-Only Intake of Home-Produced Cabbage (g/kg-day) (.xls, 28K)
  • Table 13–37 Consumer-Only Intake of Home-Produced Carrots (g/kg-day) (.xls, 29K)
  • Table 13–38 Consumer-Only Intake of Home-Produced Corn (g/kg-day) (.xls, 29K)
  • Table 13–39 Consumer-Only Intake of Home-Produced Cucumbers (g/kg-day) (.xls, 29K)
  • Table 13–40 Consumer-Only Intake of Home-Produced Eggs (g/kg-day) (.xls, 29K)
  • Table 13–41 Consumer-Only Intake of Home-Produced Game (g/kg-day) (.xls, 29K)
  • Table 13–42 Consumer-Only Intake of Home-Produced Lettuce (g/kg-day) (.xls, 29K)
  • Table 13–43 Consumer-Only Intake of Home-Produced Lima Beans (g/kg-day) (.xls, 29K)
  • Table 13–44 Consumer-Only Intake of Home-Produced Okra (g/kg-day) (.xls, 28K)
  • Table 13–45 Consumer-Only Intake of Home-Produced Onions (g/kg-day) (.xls, 29K)
  • Table 13–46 Consumer-Only Intake of Home-Produced Other Berries (g/kg-day) (.xls, 28K)
  • Table 13–47 Consumer-Only Intake of Home-Produced Peaches (g/kg-day) (.xls, 29K)
  • Table 13–48 Consumer-Only Intake of Home-Produced Pears (g/kg-day) (.xls, 28K)
  • Table 13–49 Consumer-Only Intake of Home-Produced Peas (g/kg-day) (.xls, 29K)
  • Table 13–50 Consumer-Only Intake of Home-Produced Peppers (g/kg-day) (.xls, 29K)
  • Table 13–51 Consumer-Only Intake of Home-Produced Pork (g/kg-day) (.xls, 29K)
  • Table 13–52 Consumer-Only Intake of Home-Produced Poultry (g/kg-day) (.xls, 29K)
  • Table 13–53 Consumer-Only Intake of Home-Produced Pumpkins (g/kg-day) (.xls, 29K)
  • Table 13–54 Consumer-Only Intake of Home-Produced Snap Beans (g/kg-day) (.xls, 29K)
  • Table 13–55 Consumer-Only Intake of Home-Produced Strawberries (g/kg-day) (.xls, 29K)
  • Table 13–56 Consumer-Only Intake of Home-Produced Tomatoes (g/kg-day) (.xls, 29K)
  • Table 13–57 Consumer-Only Intake of Home-Produced White Potatoes (g/kg-day) (.xls, 29K)
  • Table 13–58 Consumer-Only Intake of Home-Produced Exposed Fruit (g/kg-day) (.xls, 29K)
  • Table 13–59 Consumer-Only Intake of Home-Produced Protected Fruits (g/kg-day) (.xls, 29K)
  • Table 13–60 Consumer-Only Intake of Home-Produced Exposed Vegetables (g/kg-day) (.xls, 29K)
  • Table 13–61 Consumer-Only Intake of Home-Produced Protected Vegetables (g/kg-day) (.xls, 29K)
  • Table 13–62 Consumer-Only Intake of Home-Produced Root Vegetables (g/kg-day) (.xls, 29K)
  • Table 13–63 Consumer-Only Intake of Home-Produced Dark Green Vegetables (g/kg-day) (.xls, 29K)
  • Table 13–64 Consumer-Only Intake of Home-Produced Deep Yellow Vegetables (g/kg-day) (.xls, 29K)
  • Table 13–65 Consumer-Only Intake of Home-Produced Other Vegetables (g/kg-day) (.xls, 29K)
  • Table 13–66 Consumer-Only Intake of Home-Produced Citrus (g/kg-day) (.xls, 29K)
  • Table 13–67 Consumer-Only Intake of Home-Produced Other Fruit (g/kg-day) (.xls, 30K)

Home-Produced Food Intake - Related Links

  • USDA Agricultural Research Service. Food Surveys Research Group (Beltsville, MD) provides a variety of information about USDA's food intake survey collection methods and data.

Spreadsheets

Source: Exposure Factors Handbook released on October 3, 2011.
All files are in MS Excel format.

Download all tables in this chapter (.xlsx, 49K)

  • Table 14–3 Per Capita Total Food Intake, Edible Portion, Uncooked (.xls, 28K)
  • Table 14–4 Per Capita Intake of Total Food and Intake of Major Food Groups (g/day, edible portion, uncooked) (.xls, 45K)
  • Table 14–5 Per Capita Intake of Total Food and Intake of Major Food Groups (g/kg-day, edible portion, uncooked) (.xls, 39K)
  • Table 14–12 Intake of Total Food (g/kg-day), Edible Portion, Uncooked Weight (.xls, 26K)

Total Food Intake - Related Links

  • Dietary Exposure Evaluation Model and Food Commodity Intake Database (DEEM-FCIDTM). EPA's Dietary Exposure Evaluation Model and Food Commodity Intake Database (DEEM-FCIDTM) is a dietary exposure model for estimating exposure to pesticides in foods in the diets of the U.S. population. The software incorporates food consumption data from the National Health and Nutrition Examination Survey (NHANES) conducted in 2003-2006.
  • National Health and Nutritional Examination Survey (NHANES), conducted by the CDC, is an ongoing program of studies designed to collect information about the health and nutritional status of the US population. Data collection includes information on food and water intake over 2 non-consecutive days.
  • Continuing Survey of Food Intake by Individuals (CSFII) 1994-96, 1998 CD-ROM. The dataset includes information from all individuals who participated in the Continuing Survey of Food Intakes by Individuals (CSFII) in 1994-96 and 1998 and the Diet and Health Knowledge Survey (DHKS) in 1994-96. This release also includes the Technical Support Databases for CSFII 1994-96, 1998 (food codes, nutrient values, and recipes).
  • Food Commodity Intake Database (FCID). EPA's Office of Pesticide Programs developed the Food Commodity Intake Database (FCID) by converting NHANES data on the foods people reported eating to the quantities of agricultural commodities eaten, including water that was added in the preparation of foods and beverages.
  • Joint Institute for Food Safety and Applied Nutrition (JIFSAN) is a partnership between the United States Food and Drug Administration (FDA) and the University of Maryland to ensure the safety of the food supply. JIFSAN houses EPA's Food Commodity Intake Database.

Spreadsheets

Source: Exposure Factors Handbook released on October 3, 2011.
All files are in MS Excel format.

Download all tables in this chapter (.xlsx, 15K)

  • Table 15–17 Average Daily Human Milk Intake (mL/kg-day) (.xls, 24K)
  • Table 15–22 Comparison Daily Lipid Intake Based on Lipid Content Assumptions (mL/kg-day) (.xls, 22K)
  • Table 15–23 Distribution of Average Daily Lipid Intake (mL/kg-day) Assuming 4% Milk Lipid Content (.xls, 22K)

Human Milk Intake - Related Links

  • Scanlon, KS; Grummer-Strawn, L; Shealy, KR; Jefferds, ME; Chen, J. (2007) Breastfeeding trends and updated national health objectives for exclusive breastfeeding - United States, birth years 2000-2004. MMWR 56(30):760-763.
  • CDC Breastfeeding website provides information regarding breastfeeding practices in the U.S.
  • Breastfeeding initiatives from the American Academy of Pediatrics
  • The National Academy of Science 1991 report that summarizes research in understanding the relationship between the nutrition of healthy mothers and the outcomes of lactation. Chapter 5 of this reference discusses milk volume.

Spreadsheets

Source: Exposure Factors Handbook released on October 3, 2011.
All files are in MS Excel format.

Download all tables in this chapter (.xlsx, 41K)

  • Table 7–8 Mean Proportion (%) of Children's Total Skin Surface Area, by Body Part (.xls, 24K)
  • Table 7–9 Mean and Percentile Skin Surface Area (m2) Derived From U.S. EPA Analysis of NHANES 1999–2006 Males and Females Combined for Children <21 Years and NHANES 2005–2006 for Adults >21 Years (.xls, 26K)
  • Table 7–10 Mean and Percentile Skin Surface Area (m2) Derived From U.S. EPA Analysis of NHANES 1999–2006 for Children <21 Years and NHANES 2005–2006 for Adults >21 Years, Male (.xls, 26K)
  • Table 7–11 Mean and Percentile Skin Surface Area (m2) Derived From U.S. EPA Analysis of NHANES 1999–2006 for Children <21 Years and NHANES 2005–2006 for Adults >21 Years, Females (.xls, 26K)
  • Table 7–12 Surface Area of Adult Male (21 years and older) in Square Meters (.xls, 24K)
  • Table 7–13 Surface Area of Adult Females (21 years and older) in Square Meters (.xls, 23K)
  • Table 7–15 Descriptive Statistics for Surface Area/Body Weight (SA/BW) Ratios (m2/kg) (.xls, 23K)
  • Table 7–16 Estimated Percent of Adult Skin Surface Exposed During Outdoor Activities (.xls, 22K)
  • Table 7–35 Outdoor Hand Contact With Surfaces—Frequency, Children 1 to 5 Years (contacts/hour) (.xls, 23K)

Dermal - Related Links

  • National Health and Nutritional Examination Survey (NHANES), conducted by the CDC, is an ongoing program of studies designed to collect information about the health and nutritional status of the US population. Data collection includes information on body weight and height that may be used in estimating total body surface area.

Spreadsheets

Source: Exposure Factors Handbook released on October 3, 2011.
All files are in MS Excel format.

Download all tables in this chapter (.xlsx, 32K)

  • Table 8–3 Mean and Percentile Body Weights (kg) Derived from NHANES (1999–2006) Male and Female Combined (.xls, 24K)
  • Table 8–4 Mean and Percentile Body Weights (kg) for Males Derived from NHANES (1999–2006) (.xls, 23K)
  • Table 8–5 Mean and Percentile Body Weights (kg) for Females Derived from NHANES (1999–2006) (.xls, 23K)
  • Table 8–29 Estimated Body Weights of Pregnant Women–NHANES (1999–2006) (.xls, 22K)

Body Weight - Related Links

  • National Health and Nutritional Examination Survey (NHANES), conducted by the CDC, is an ongoing program of studies designed to collect information about the health and nutritional status of the US population. Data collection includes information on body weight.

Spreadsheets

Source: Exposure Factors Handbook released on October 3, 2011.
All files are in MS Excel format.

Lifetime - Related Links

  • The US Census Bureau 2012 statistical abstract
  • CDC publishes National Vital Statistics Report that provides information of death, mortality, and life expectancy.
  • Life expectancy at birth from various countries in the world

Spreadsheets

Source: Exposure Factors Handbook released on October 3, 2011.
All files are in MS Excel format.

Download all tables in this chapter (.xlsx, 530K)

  • Table 16–15 Time Spent (minutes/day) in Various Rooms at Home and in All Rooms Combined Whole Population and Doers Only, Children <21 years (.xls, 42K)
  • Table 16–16 Time Spent (minutes/day) in Various Rooms at Home and in All Rooms Combined, Doers Only (.xls, 79K)
  • Table 16–17 Time Spent (minutes/day) at Selected Indoor Locations Whole Population and Doers Only, Children <21 years (.xls, 32K)
  • Table 16–18 Time Spent (minutes/day) at Selected Indoor Locations, Doers Only (.xls, 127K)
  • Table 16–19 Time Spent (minutes/day) in Selected Outdoor Locations Whole Population and Doers Only, Children <21 Years (.xls, 31K)
  • Table 16–20 Time Spent (minutes/day) in Selected Outdoor Locations, Doers Only (.xls, 134K)
  • Table 16–23 Time Spent (minutes/day) in Selected Vehicles and All Vehicles Combined Whole Population and Doers Only, Children <21 Years (.xls, 33K)
  • Table 16–24 Time Spent (minutes/day) in Selected Vehicles, Other Mass Transit, and All Vehicles Combined, Doers Only (.xls, 70K)
  • Table 16–25 Time Spent (minutes/day) in Selected Activities Whole Population and Doers Only, Children <21 Years (.xls, 40K)
  • Table 16–26 Time Spent (minutes/day) in Selected Activities, Doers Only (.xls, 179K)
  • Table 16–27 Number of Hours Spent Working (hours/week) (.xls, 42K)
  • Table 16–29 Time Spent (minutes) Bathing, Showering, and in Bathroom Immediately After Bathing and Showering, Children <21 Years (.xls, 33K)
  • Table 16–32 Time Spent (minutes) Showering and in Shower Room Immediately After Showering (minutes/shower) (.xls, 36K)
  • Table 16–34 Time Spent (minutes) Giving and Taking the Bath(s) and in Bathroom Immediately After Bathing (minutes/bath) (.xls, 35K)
  • Table 16–35 Time Spent Altogether in the Shower or Bathtub and in the Bathroom Immediately Following a Shower or Bath (minutes/bath) (.xls, 37K)
  • Table 16–36 Time Spent (minutes/day) Bathing and Showering, Doers Only (.xls, 33K)
  • Table 16–40 Time Spent (minutes/month) Swimming in Freshwater Swimming Pool, Children <21 Years (.xls, 26K)
  • Table 16–42 Time Spent (minutes/month) in Freshwater Swimming Pool, Doers Only (.xls, 29K)
  • Table 16–43 Time Spent (minutes/day) Playing on Dirt, Sand/Gravel, or Grass Whole Population and Doers Only, Children <21 Years (.xls, 31K)
  • Table 16–44 Number of Minutes Spent Playing or Working on Selected Outdoor Surfaces, Doers Only (.xls, 47K)
  • Table 16–45 Time Spent (minutes/day) Working or Being Near Excessive Dust in the Air, Children <21 Years (.xls, 26K)
  • Table 16–46 Time Spent (minutes/day) Working or Being Near Excessive Dust in the Air, Doers Only (.xls, 29K)
  • Table 16–49 Time Spent (minutes/day) With Smokers Present, Children <21 Years (.xls, 25K)
  • Table 16–50 Time Spent (minutes/day) With Smokers Present, Doers Only (.xls, 33K)
  • Table 16–51 Number of Minutes Spent Smoking and Smoking Cigars or Pipe Tobacco (minutes/day) (.xls, 37K)
  • Table 16–52 Number of Minutes Spent (at home) Working or Being Near Food While Fried, Grilled, or Barbequed (minutes/day) (.xls, 29K)
  • Table 16–53 Number of Minutes Spent (at home) Working or Being Near Open Flames Including Barbeque Flames (minutes/day) (.xls, 29K)
  • Table 16–54 Number of Minutes Spent Running, Walking, or Standing Alongside a Road With Heavy Traffic (minutes/day) (.xls, 29K)
  • Table 16–55 Number of Minutes Spent in a Car, Van, Truck, or Bus in Heavy Traffic (minutes/day) (.xls, 29K)
  • Table 16–56 Number of Minutes Spent in a Parking Garage or Indoor Parking Lot (minutes/day) (.xls, 29K)
  • Table 16–57 Number of Minutes Spent Walking Outside to a Car in the Driveway or Outside Parking Areas (minutes/day) (.xls, 29K)
  • Table 16–58 Number of Minutes Spent Running or Walking Outside Other Than to the Car (minutes/day) (.xls, 29K)
  • Table 16–64 Time Spent at Home While the Windows or Outside Door Were Left Open (minutes/day) (.xls, 36K)
  • Table 16–108 Descriptive Statistics for Residential Occupancy Period (years) (.xls, 23K)
  • Table 16–109 Descriptive Statistics for Both Sexes by Current Age (.xls, 25K)
  • Table 16–111 Percent of Householders Living in Houses for Specified Ranges of Time, and Statistics for Years Lived in Current Home (.xls, 26K)

Activity Factors - Related Links

  • U.S. DOL (Department of Labor). (2007) American time use survey - 2006. Results. News release, June 28, 2007. Bureau of Labor Statistics, Washington, DC. The survey measures the amount of time people spend doing various activities including paid work, childcare, volunteering, and socializing.
  • Wiley, JA; Robinson, JP; Cheng, Y; Piazza, T; Stork, L; Plasden, K. (1991) Study of children's activity patterns. California Environmental Protection Agency, Air Resources Board Research Division. Sacramento, CA.
  • CHAD Data base. Consolidated Human Activity Database (CHAD) contains data obtained from pre-existing human activity studies that were collected at city, state, and national levels. CHAD is intended to be an input file for exposure/intake dose modeling and/or statistical analysis. CHAD is a master database providing access to other human activity databases using a consistent format. This facilitates access and retrieval of activity/and questionnaire information from those databases that EPA currently has access to-and-uses-in its various regulatory analyses undertaken by program offices.
  • Stochastic human exposure and dose simulation (SHEDS) model. SHEDS is a model that may be used to estimate aggregate residential exposure using probabilistic techniques that incorporate time-activity data.
  • The Centers for Disease Control and Prevention (CDC) conducts a national telephone survey on physical activity. It attempts to measure a person's physical activity in leisure-time, household, and transport.

Spreadsheets

Source: Exposure Factors Handbook released on October 3, 2011.
All files are in MS Excel format.

Download all tables in this chapter (.xlsx, 136K)

  • Table 17–4 Frequency of Use for Household Solvent Products (users only) (.xls, 28K)
  • Table 17–5 Exposure Time of Use for Household Solvent Products (users only) (.xls, 27K)
  • Table 17–6 Amount of Products Used for Household Solvent Products (users only) (.xls, 27K)
  • Table 17–7 Time Exposed After Duration of Use for Household Solvent Products (users only) (.xls, 27K)
  • Table 17–9 Percentile Rankings for Total Exposure Time in Performing Household Tasks (.xls, 24K)
  • Table 17–10 Mean Percentile Rankings for Frequency of Performing Household Tasks (.xls, 25K)
  • Table 17–11 Mean and Percentile Rankings for Exposure Time per Event of Performing Household Tasks (.xls, 25K)
  • Table 17–12 Total Exposure Time for Ten Product Groups Most Frequently Used for Household Cleaning (.xls, 25K)
  • Table 17–13 Total Exposure Time of Painting Activity of Interior Painters (hours) (.xls, 24K)
  • Table 17–14 Exposure Time of Interior Painting Activity/Occasion (hours) and Frequency of Occasions Spent Painting per Year (.xls, 24K)
  • Table 17–15 Amount of Paint Used by Interior Painters (.xls, 24K)
  • Table 17–16 Frequency of Use and Amount of Product Used for Adhesive Removers (.xls, 25K)
  • Table 17–18 Frequency of Use and Amount of Product Used for Spray Paint (.xls, 24K)
  • Table 17–20 Frequency of Use and Amount of Product Used for Paint Removers/Strippers (.xls, 24K)
  • Table 17–22 Number of Minutes Spent Using Any Microwave Oven (minutes/day) (.xls, 23K)
  • Table 17–23 Number of Minutes Spent in Activities Working With or Near Freshly Applied Paints (minutes/day) (.xls, 23K)
  • Table 17–24 Number of Minutes Spent in Activities Working With or Near Household Cleaning Agents Such as Scouring Powders or Ammonia (minutes/day) (.xls, 23K)
  • Table 17–25 Number of Minutes Spent in Activities (at home or elsewhere) Working With or Near Floorwax, Furniture Wax, or Shoe Polish (minutes/day) (.xls, 24K)
  • Table 17–26 Number of Minutes Spent in Activities Working With or Near Glue (minutes/day) (.xls, 26K)
  • Table 17–27 Number of Minutes Spent in Activities Working With or Near Solvents, Fumes, or Strong Smelling Chemicals (minutes/day) (.xls, 24K)
  • Table 17–28 Number of Minutes Spent in Activities Working With or Near Stain or Spot Removers (minutes/day) (.xls, 24K)
  • Table 17–29 Number of Minutes Spent in Activities Working With or Near Gasoline or Diesel-Powered Equipment, Besides Automobiles (minutes/day) (.xls, 24K)
  • Table 17–30 Number of Minutes Spent in Activities Working With or Near Pesticides, Including Bug Sprays or Bug Strips (minutes/day) (.xls, 24K)
  • Table 17–39 Amount of Test Product Used (grams) for Lipstick, Body Lotion, and Face Cream (.xls, 32K)

Consumer Products - Related Links

  • NLM Household Products Database (HPD) of the National Library of Medicine database provides information on over 7,000 consumer brands including auto products; products used inside the home; pesticides; landscape and yard; personal care; home maintenance, arts, and crafts; pet care; and home office. The information includes chemical ingredients, specific brands that contain those ingredients, and acute and chronic health effects associated with specific ingredients. The database does not contain any information on frequency or amount of product used.
  • American Cleaning Institute
  • Personal Care Products Council

Spreadsheets

Source: Exposure Factors Handbook released on October 3, 2011.
All files are in MS Excel format.

Download all tables in this chapter (.xlsx, 35K)

  • Table 19–8 Summary of Residential Volume Distributions Based on U.S. DOE (2008a)a (m3) (.xls, 21K)
  • Table 19–9 Summary of Residential Volume Distributions Based on Versar (1990) (m3) (.xls, 20K)
  • Table 19–20 Average Estimated Volumes of U.S. Commercial Buildings, by Primary Activity (.xls, 26K)
  • Table 19–21 Non-Residential Buildings: Hours per Week Open and Number of Employees (.xls, 26K)
  • Table 19–24 Summary Statistics for Residential Air Exchange Rates (in ACH), by Region (.xls, 22K)
  • Table 19–25 Summary of Major Projects Providing Air Exchange Measurements in the PFT Database (.xls, 27K)
  • Table 19–26 Distributions of Residential Air Exchange Rates (in ACH) by Climate Region and Season (.xls, 25K)

Building Characteristics - Related Links

  • Johnson, PC; Ettinger, RA. (1991) Model for subsurface vapor intrusion into buildings. U.S. Environmental Protection Agency, Waste and Cleanup Risk Assessment.
  • U.S. DOE (Department of Energy). (2008a) U.S. EPA analysis of survey data. Residential energy consumption survey (RECS) Report No. DOE/EIA-0314 (93). U.S. Department of Energy, Energy Information Administration, Washington, DC.
  • U.S. DOE (Department of Energy). (2008b). U.S. EPA analysis of survey data. Commercial buildings energy consumption survey (CBECS). Form EIA-871A. U.S. Department of Energy, Energy Information Administration, Washington, DC.
  • The Building Assessment Survey and Evaluation Study.

EPA ExpoBox

  • Basic Information
  • Approaches
    • - Direct Measurement
    • - Exposure Reconstruction
    • - Indirect Estimation
  • Media
    • - Air
    • - Aquatic Biota
    • - Consumer Products
    • - Food
    • - Soil and Dust
    • - Water and Sediment
  • Routes
    • - Dermal
    • - Ingestion
    • - Inhalation
  • Tiers and Types
    • - Deterministic and Probabilistic
    • - Screening-Level and Refined
    • - Aggregate and Cumulative
  • Lifestages and Populations
    • - General Population
    • - Highly Exposed
    • - Lifestages
    • - Occupational Workers
    • - Residential Consumers
  • Chemical Classes
    • - Inorganics and Fibers
    • - Nanomaterials
    • - Other Organics
    • - Pesticides
  • Exposure Factors
  • Tutorials
  • Glossaries
  • Unit Conversion
  • Uncertainty and Variability
Contact Us about ExpoBox
Contact Us to ask a question, provide feedback, or report a problem.
Last updated on April 1, 2025
  • Assistance
  • Spanish
  • Arabic
  • Chinese (simplified)
  • Chinese (traditional)
  • French
  • Haitian Creole
  • Korean
  • Portuguese
  • Russian
  • Tagalog
  • Vietnamese
United States Environmental Protection Agency

Discover.

  • Accessibility Statement
  • Budget & Performance
  • Contracting
  • EPA www Web Snapshot
  • Grants
  • No FEAR Act Data
  • Plain Writing
  • Privacy
  • Privacy and Security Notice

Connect.

  • Data
  • Inspector General
  • Jobs
  • Newsroom
  • Regulations.gov
  • Subscribe
  • USA.gov
  • White House

Ask.

  • Contact EPA
  • EPA Disclaimers
  • Hotlines
  • FOIA Requests
  • Frequent Questions
  • Site Feedback

Follow.