
Basic Information about the Mystic River Buoy
Buoy Sampling View
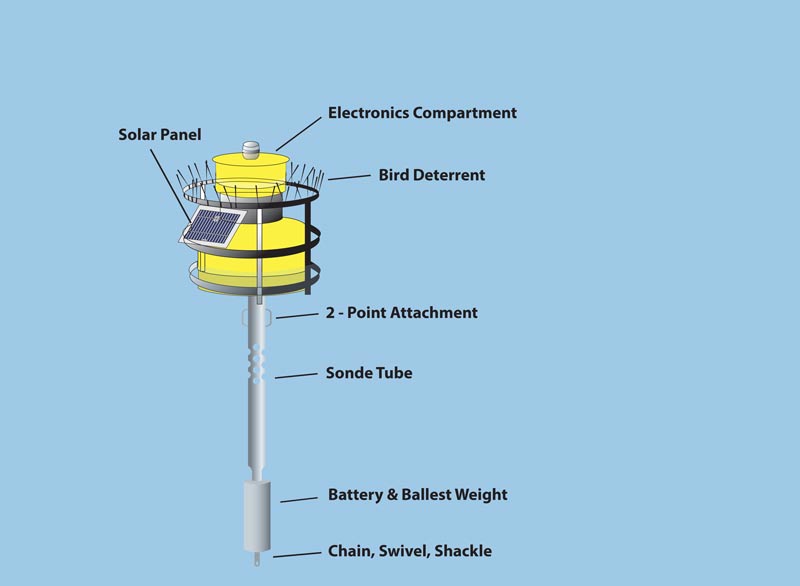
Buoy Sampling Equipment
Live Data Stream
Water Monitoring buoy in the Mystic River outside Blessing of the Bay Boathouse.
Every 15 minutes, this self-contained solar powered buoy takes measurements. The data is transmitted in near real-time using telemetry for remote access on EPA's website. EPA scientist and water quality managers use the data from this buoy to assess water quality conditions and to help track cyanobacteria (blue-green algae) blooms.
EPA measures real-time water quality using a sonde with sensors mounted on an anchored floating buoy. The sensors on the buoy are located 1 meter below the water's surface and measure the following:
- temperature
- dissolved oxygen
- specific conductance (conductivity)
- pH
- turbidity
- chlorophyll
- phycocyanin
Live Water Quality Data for the Mystic River
Water Surface View
Algal Blooms

Nutrients, primarily phosphorus, are a chief culprit for dramatic algae blooms that can plague the watershed with blue-green algae during the summer months.
These "blue-green" algae blooms, are a form of bacterial known as Cyanobacteria, whose cells may release a toxin when they die. Exposure to the toxin can cause skin rashes and irritate the nose, eyes or throat, and if ingested can lead to serious liver and nervous system damage. Other harmful effects of the algae include reduced water clarity, nuisance scum, and reduced oxygen in the water which is necessary for a healthy fish habitat.
Invasive Water Chestnuts

Water chestnut is an invasive aquatic plant, native to Asia, Europe and Africa. Floating leaves form continuous mats over the Mystic River, and other slow-moving freshwater systems, making some sections of the main stem difficult to boat in. The mats crowd out native plants and impede boating, fishing, and swimming.
Decomposition of large populations of water chestnuts affects water quality by reducing dissolved oxygen levels, which can disturb fish and other aquatic life. The water chestnut is capable of rapid growth and spread Elevated nutrients in this urban watershed help this plant thrive. Water chestnuts are removed from the Mystic River by hand pulling or mechanical harvesting.
Wet Weather Events

Wet weather, or rain, causes several changes in water quality in the Mystic. If it is a prolonged high intensity storm, it will trigger discharges from Combined Sewer Overflows carrying fecal matter and other pollutants. This will increase the amount of suspended (neither sinking nor floating) material in the Mystic and can increase the measurement of turbidity. It will also dramatically increase bacterial concentrations (which are not measured by the buoy) in the watershed.
Most rain events cause the discharge of stormwater through the hundreds of stormwater outfalls in the Mystic. Because stormwater flushes dirt and other surface pollutants into the River, higher turbidity readings can occur. If rain occurs during hot summer weather, it may cause a temporary increase in water temperature; this is a result of stormwater being heated as it flows over hot impervious surfaces such as streets, roofs and parking lots on its way to the River and tributaries. Higher water temperatures will increase the likelihood of algal blooms, which trigger increases in chlorophyll and phycocyanin measurements from the buoy.
Water Quality View
Urban Runoff View
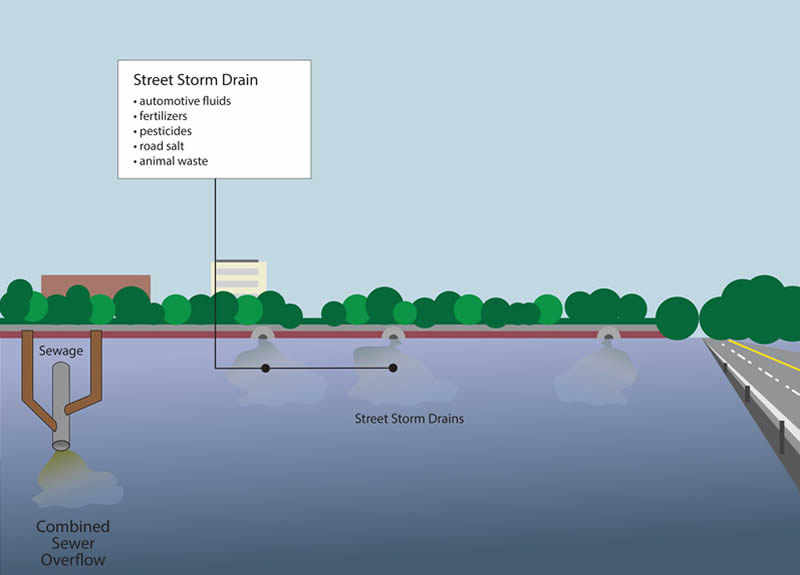
Storm drain pipes and Combined Sewer Overflows (CSOs) have long been a culprit for discharge of pollutants into urban waterways like the Mystic River and watershed. Street storm drains can carry automotive fluids, fertilizers, pesticides, road salt and animal waste with rain water that can pollute the river. CSOs occur when the sewer system is overloaded and wastewater is carried through the stormwater pipes and discharged into the River.
The sediment in the Mystic River Watershed is a good snapshot into its history. The layers of sediment with different levels of contaminants can show the past uses of the river and watershed.