
GenOn (formerly Mirant) Kendall Station Final NPDES Permit
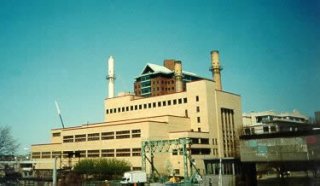
Background: EPA and the Massachusetts Department of Environmental Protection have issued a final National Pollutant Discharge Elimination System (NPDES) permit for the Mirant Kendall Station (MKS) power plant in Cambridge, Massachusetts to meet the requirements of the Clean Water Act. This final permit seeks to address potential adverse impacts to sustainable fish populations, aesthetics, and recreation due to heat, excessive algae growth, reduced water clarity and the intake of cooling water. This permit is an important component of continuing broader public and private efforts to restore the health of the Charles River Basin and Boston Harbor. press release »
Major Permit Conditions: This permit includes the following new protective requirements and conditions:
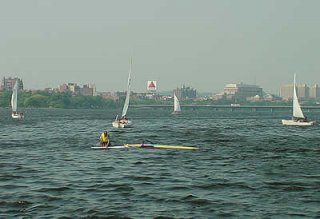
- Zone of Passage and Habitat: A seasonal safe "zone of passage and habitat", which covers roughly fifty percent of the Lower Basin, has been created along the Boston side of the Charles River in order to protect fish populations and aquatic habitat. Two species of river herring, alewife and blueback herring, use the Lower Charles River Basin for their annual adult migration and spawning run. The Charles River supports one of the largest river herring runs in Massachusetts Bay.
- In-stream Temperatures: Maximum seasonal allowable in-stream river temperatures have been established within the zone of passage and habitat. Critical river temperature permit limits range from 61 degrees Fahrenheit during early spring for yellow perch up to 81 and 83 degrees Fahrenheit during the summer for river herring. In addition, river temperatures in this safety zone cannot increase by more than 5 degrees Fahrenheit above upstream ambient river temperatures during a 24-hour average period. If real-time monitoring indicates that any of these temperature limits are exceeded, the power plant will need to modify its operations to reduce thermal discharges to the river.
- Discharge Temperature and Location: An annual average of 70 MGD of non-contact cooling water can be discharged at temperatures up to 105° F from the present discharge pipes as long as these in-stream temperatures are not exceeded.
- Barrier Net: A fine-mesh barrier net system or other similar protective device must be installed in front of the facility's cooling water intake structure to limit the number of fish that are trapped or pulled into the power plant when river cooling water is pumped into the facility.
- Real-time Monitoring: Continuous water quality monitoring will be required in the Lower River Basin. This monitoring will provide real-time temperature measurements at eight strategic upstream and downstream river locations. The real-time discharge monitoring information will be made available to EPA and MassDEP to ensure continued permit compliance and immediate protection of the Charles River.
Public Comment: EPA accepted public comment on the draft permit between June 14, 2004 and October 14, 2004. A public hearing was held on September 13, 2004. EPA received numerous written and oral comments on the draft permit. EPA greatly appreciates the time, effort, information and expertise that commenters have contributed to the development of this permit. Summaries of these comments and EPA's responses to comments have been complied into a document listed below. "Responses to Comments: Public Review of Mirant Kendall Station".
Contact
George Papadopoulos (papadopoulos.george@epa.gov)
USEPA
5 Post Office Square - Suite 100
Mailcode: OEP 06-1
Boston, MA 02109-3912
Phone: (617) 918-1579
Fax: (617) 918-1505
For more detailed information: The documents contained on this page are PDF'd (portable document format) copies of the originals. These documents include the final permit and supporting documents, the Responses to Public Comments, and documents related to the draft permit.
Mirant Kendall Station (MKS) Documents Related to Final Permit - 2008
- Final Permit Modification (pdf)
- Public Q & A (pdf)
- EPA's Press Release on Mirant Kendall Station Permit
- Mirant Kendall Station Final NPDES Permit (pdf)
- Water Quality Certification (pdf)
- Coastal Zone Management Consistency Letter (pdf)
Responses to Comments: Public Review of Mirant Kendall Station
- Table of Contents (pdf)
- Introduction (pdf)
- A. The Permit Process (pdf)
- B. Mirant Kendall's Operations (pdf)
- C. In-Stream Thermal Limits (pdf)
- D. Proposed Zone of Passage and Habitat (pdf)
- E. Proposed New Outfall and Diffuser (pdf)
- F. CWA Section 316(a) Variance-Based Thermal Discharge Limits (pdf)
- G. Permanent Hydrological Modifications (pdf)
- H. CWA Section 316(b)-Based Cooling Water Intake Limits and Barrier Net Installation (pdf)
- I. Monitoring and Reporting Requirements (pdf)
- J. Other Permit Limits (pdf)
- K. Projected Effects of the Permit on Mirant Kendall's Operations (pdf)
- L. General Comments (pdf)
- M. The Future of Mirant Kendall Station (pdf)
List of Figures and Tables
- B1-1. Mirant Kendall Station existing and future cooling water discharge parameters (pdf)
- B1-2. Mirant Kendall Station average daily heat load values from June through September for the years 1998 through 2005 (pdf)
- B1-3. Mirant Kendall Station monthly average heat load for the summer months (June through September) from 1998 through 2005 (pdf)
- B1-4. Number of days each summer (June through September) that the average daily heat load from Kendall Station was recorded within specific heat load ranges, 1998 through 2005 (pdf)
- C3-1. 2004 Pushnet, Alewives vs. Distance mean number of alewives captured per pushnet event at each station (July-September, night only) vs. station distance to Kendall discharge (pdf)
- C3-2. 2005 Pushnet, Alewives vs. Distance: number of juvenile alewives caught per pushnet event (July-September, nighttime only) at each station vs. station distance from the Kendall discharge (pdf)
- C3-3. 2005 Pushnet, Alewives vs. Distance: number of juvenile alewives caught per pushnet event (July-September, nighttime only) at each station vs. station distance from the Kendall discharge. MIT station (at 0.8 miles) information removed (pdf)
- C3-4. 2004 Pushnet, Bluebacks vs. Distance: median number of juvenile bluebacks collected at each pushnet station (nighttime data, August–September) vs. distance (miles) from each station to the Kendall discharge (pdf)
- C3-5. 2005 Pushnet, Bluebacks vs. Distance: median number of juvenile bluebacks per station (July-September, nighttime only) vs. station distance from the Kendall discharge (pdf)
- C3-6. 2004 Pushnet, Temperature and Distance: mean surface water temperature at each station (nighttime data, August–September) at time pushnet sampling vs. distance from each station to the Kendall discharge (pdf)
- C3-7. 2005 Pushnet, Temperature vs. Distance: mean surface water temperature at each pushnet station at time of sampling (July-September, night only) vs. station distance from the Kendall discharge (pdf)
- C3-8. 2004 Pushnet, Alewives: number of juvenile alewives caught per pushnet sampling event at different water temperatures from July-September (nighttime only), and sampling events per temperature category (pdf)
- C3-9. Pushnet, Alewives: number of juvenile alewives caught per pushnet sampling event at different water temperatures from July-September (nighttime only) and sampling events per temperature category (pdf)
- C3-10. 2003-2005 Seine, Alewives vs. Station: number of juvenile alewives caught per 1000 sq. ft. of area seined (nighttime only) at Hyatt and Lagoon stations, 1.6 and 0.6 miles upstream of the Kendall discharge, respectively, vs. year (pdf)
- C3-11. 2003 Shoreline Seine, Alewives: number of juvenile alewives caught per 1000 sq. ft. of area sampled from July-September (pdf)
- C3-12. 2004 Shoreline Seine, Alewives: number of juvenile alewives caught per 1000 sq. ft of area sampled from July–September (pdf)
- C3-13. 2005 Shoreline Seine, Alewives: number of juvenile alewives caught per 1000 sq. ft of area sampled from July–September (pdf)
- C3-14. 2004 Pushnet, Alewives vs. Temperature: mean number of juvenile alewives caught per sampling event at each station (July-September, nighttime only) vs. mean surface water temperature at each station at time of pushnet sampling (pdf)
- C3-15. 2005 Pushnet, Alewives vs. Temperature: mean number of juvenile alewives caught per sampling event at each station (July-September, nighttime only) vs. mean surface water temperature at each station at time of pushnet sampling (pdf)
- C3-16. 2005 Pushnet, Alewives vs. Temperature: number of juvenile alewives caught per sampling event at each station (July-September, nighttime only) vs. mean surface water temperature at each station over sampling period; MIT data removed (pdf)
- C3-17. 2004 Pushnet, Bluebacks vs. Temperature: median number of juvenile bluebacks caught at each station during sampling events (nighttime, August-September) vs. mean surface water temperature at each station at time of sampling (pdf)
- C3-18. 2005 Pushnet, Bluebacks vs. Temperature: median number of juvenile bluebacks caught during sampling events (nighttime, July-September) at each station vs. mean surface water temperature (F) at each station at time of pushnet sampling (pdf)
- C37-1. The maximum, minimum and average Charles River temperatures recorded from the cooling water intake of Kendall Station from hourly readings for the month of April in the years 1994 through 2002. These temperatures are judged to approximate ambient conditions in the river. (Mirant Kendall, 2003) (pdf)
- C45 CLF-1. Maximum temperature limits proposed by CLF for the protection of all life stages of yellow perch, the resident species in the Charles River considered most sensitive to temperature, compared with the protective limits used to select the permit limits (pdf)
- C45 CLF-2. Maximum temperature limits proposed by CLF for the protection of all life stages of alewife, the anadromous species in the Charles River considered most sensitive to temperature, compared with the protective limits used to select the permit limits (pdf)
- C45 CLF-3. Maximum temperature limits proposed by CLF for the protection of the most temperature sensitive life stage of resident and anadromous species (yellow perch and alewife), compared with the protective limits included in the permit (pdf)
- C45 CLF-4. Maximum temperature limits proposed by CLF for the protection of the most temperature sensitive life stage of resident and anadromous species (yellow perch and alewife), compared with maximum, average and minimum Kendall Station intake hourly temperatures from 1994 through 2002 (pdf)
- E19-2. Relative Percent Differences in Algal Counts Between the Upstream and Downstream Portions of the Lower Basin (pdf)
- H14-1. Number of fish impinged and collected, all species combined, at the CWIS of Kendall Station, presented by month and year from 1999 through 2005 (pdf)
Mirant Kendall Station (MKS) Documents Related to the Draft Permit
- MKS Three Page Summary Fact Sheet (pdf)
- MKS Draft Permit (pdf)
- Draft Permit Attachments:
- Attachment A - Charles River Temperature Limits by Time of Year in the Zone of Passage and Habitat (pdf)
- Attachment B - Aerial View of MKS and Instream Continuous Monitoring Stations (pdf)
- Attachment C - Freshwater Chronic Toxicity Test Procedure and Protocol (pdf)
- Attachment D - Zone of Passage and Habitat Map (pdf)
- Attachment E - Webpage temperatures map (pdf)
- Attachment F - 30 day tracking charts (pdf)
- Attachment G - Supplemental Monthly Report Forms A & B (pdf)
- Attachment H - Kendall Biological Monitoring Stations (pdf)
- Attachment I - Water Quality and Biological Monitoring Requirements (pdf)
- Part II - General Conditions (pdf)
- Mirant Kendall Station Fact Sheet (pdf)
- Fact Sheet Figure 1 - Site Location Map (pdf)
- Fact Sheet Figure 2 - Outfall Locations (pdf)
- Fact Sheet Figure 3 - Kendall Equipment Upgrade Project (pdf)
- Fact Sheet Figure 4 - Transverse Cross-Section of Fish Net Barrier (pdf)
- Fact Sheet Attachment A - Requirements to Address Water Quality Impacts in the Charles River due to Excessive Algae Growth (pdf)
- MKS 316(a) and (b) Determination Document (pdf)
- Determination Document Figures:
- Figure 2.4-1: Daily Average Values for Charles River discharge, in cfs (Jan.1994 - Nov. 2002) (pdf)
- Figure 2.4-2: Daily Average Values for Charles River discharge, in cfs (June through September) (pdf)
- Figure 3.1.1-1: MKS Existing and Future Cooling Water Discharge Parameters (pdf)
- Figure 5.1-1: Temperature-Growth Curves for Major Algal Groups (pdf)
- Figure 5.3-1: MKS Average Monthly Heat Load from Hourly Values (pdf)
- Figure 5.3-2: MKS Cooling Water Discharge Temperature Monitoring Record (pdf)
- Figure 5.6-1: Maximum Temperature Limits in the Zone of Passage and Habitat (ZPH) for Yellow Perch (pdf)
- Figure 5.7-1: Maximum Temperature Limits in the Zone of Passage and Habitat (ZPH) for Alewife (pdf)
- Figure 5.7.3b-1: Expanded Map of Lower Charles Basin (pdf)
- Figure 5.7.3b-2: Expanded Map of the Charles River, up to Waltham (pdf)
- Figure 5.7.3c-1: Actual and Predicted Tolerance Responses for Adult Alewives (pdf)
- Figure 5.7.3c-2: Temperature Tolerance Responses for a Hypothetical Fish (pdf)
- Figure 5.7.3c-3: MKS Intake Continuous Temperatures for Years 1994, 1995, 1996, 2001 and 2002 (pdf)
- Figure 5.7.3c-4: MKS Intake Continuous Temperatures for Years 1995, 1997, 1998 and 2000 (pdf)
- Figure 5.8.1-1: Protective Temperature Limits For Most Sensitive Anadromous Species (pdf)
- Figure 5.8.2b-1: Percent of lower Charles River Basin Simulated to Have an Ambient Temp. Rise Greater than Specified Temps in August (pdf)
- Figure 5.8.2b-2: Aerial View of MKS and Monitoring Stations (pdf)
- Figure 5.8.2g-1: Charles River, MWRA Station 006 Surface and Bottom Temps, Year 2000 (pdf)
- Figure 5.8.2g-2: Charles River, MWRA Station 006 Surface and Bottom Temps, Year 2001 (pdf)
- Figure 5.8.2g-3: Charles River, MWRA Stations 006 and 014 Surface and Bottom Temps, Year 1999 (pdf)
- Figure 5.8.2g-4: Charles River, MWRA Station 014 Bottom Temps, Year 2000 (pdf)
- Figure 5.8.2g-5: Charles River, MWRA Station 014 Bottom Temps, Year 2001 (pdf)
- Figure 5.8.2g-6: Charles River, MWRA Stations 006 and 014 Surface and Bottom Temps, Year 1999 (pdf)
- Figure 5.8.2g-7: Charles River, MWRA Stations 006 and 014 Surface Temps, Year 2000 (pdf)
- Figure 5.8.2g-8: Charles River, MWRA Stations 006 and 014 Surface Temps, Year 2001 (pdf)
- Figure 5.8.2l-1: Charles River, MWRA Station 006 Surface Temp, Year 1999 (pdf)
- Figure 5.8.2l-2: Charles River, MWRA Station 006 Surface Temp, Year 2000 (pdf)
- Figure 5.8.2l-3: Charles River, MWRA Station 006 Surface Temp, Year 2001 (pdf)
- Figure 5.9.2-1: Charles River Continuous Temperature Data, Hourly, 8/1999 - 9/2000 (pdf)
- Figure 5.9.2-2: Charles River Continuous Temperature Data, Hourly, 6/2000 - 9/2000 (pdf)
- Figure 5.9.2-3: Charles River and MKS Continuous Temperature Data, 7/1999 - 9/1999 (pdf)
- Figure 5.9.2-4: Charles River and MKS Continuous Temperature Data, 5/15/02 - 8/23/02 (pdf)
- Figure 5.9.2-5: Charles River and MKS Continuous Temperature Data, 1/1997 - 12/1997 (pdf)
- Figure 5.9.2-6: Charles River and MKS Continuous Temperature Data, 1/1998 - 12/1998 (pdf)
- Figure 5.9.2-7: Charles River and MKS Continuous Temperature Data, 1/1999 - 12/1999 (pdf)
- Figure 5.9.2-8: Charles River and MKS Continuous Temperature Data, 8/1999 - 9/2000 (pdf)
- Figure 5.9.2-9: Charles River and MKS Continuous Temperature Data, 1/2001 - 12/2001 (pdf)
- Figure 5.9.2-10: Charles River and MKS Continuous Temperature Data, 1/1997 - 12/1997 (pdf)
- Figure 5.9.2-11: Charles River and MKS Continuous Temperature Data, 1/1998 - 12/1998 (pdf)
- Figure 5.9.2-12: Charles River and MKS Continuous Temperature Data, 1/1999 - 12/1999 (pdf)
- Figure 5.9.2-13: Charles River and MKS Continuous Temperature Data, 1/2000 - 12/2000 (pdf)
- Figure 5.9.2-14: Charles River and MKS Continuous Temperature Data, 1/2001 - 12/2001 (pdf)
- Figure 5.9.2-15: MKS Intake Continuous Temperatures Compared to Temp Limits Established in ZPH, 1994 (pdf)
- Figure 5.9.2-16: MKS Intake Continuous Temperatures Compared to Temp Limits Established in ZPH, 1995 (pdf)
- Figure 5.9.2-17: MKS Intake Continuous Temperatures Compared to Temp Limits Established in ZPH, 1996 (pdf)
- Figure 5.9.2-18: MKS Intake Continuous Temperatures Compared to Temp Limits Established in ZPH, 1997 (pdf)
- Figure 5.9.2-19: MKS Intake Continuous Temperatures Compared to Temp Limits Established in ZPH, 1998 (pdf)
- Figure 5.9.2-20: MKS Intake Continuous Temperatures Compared to Temp Limits Established in ZPH, 1999 (pdf)
- Figure 5.9.2-21: MKS Intake Continuous Temperatures Compared to Temp Limits Established in ZPH, 2000 (pdf)
- Figure 5.9.2-22: MKS Intake Continuous Temperatures Compared to Temp Limits Established in ZPH, 2001 (pdf)
- Figure 5.9.2-23: MKS Intake Continuous Temperatures Compared to Temp Limits Established in ZPH, January to June of 2002 (pdf)
- Figure 5.9.2-24: Charles River Ambient Temperatures near BU Bridge Compared to Temperature Limits Established in ZPH, 5/1997 - 8/1997 (pdf)
- Figure 5.9.2-25: Charles River Ambient Temperatures near BU Bridge Compared to Temperature Limits Established in ZPH, 5/1998 - 8/1998 (pdf)
- Figure 5.9.2-26: Charles River Ambient Temperatures near BU Bridge Compared to Temperature Limits Established in ZPH, 5/1999 - 8/1999 (pdf)
- Figure 5.9.2-27: Charles River Ambient Temperatures near BU Bridge Compared to Temperature Limits Established in ZPH, 5/2000 - 8/2000 (pdf)
- Figure 5.9.2-28: Charles River Ambient Temperatures near BU Bridge Compared to Temperature Limits Established in ZPH, 5/2001 - 8/2001 (pdf)
- Figure 5.9.2-29: Charles River Ambient Temperatures near BU Bridge Compared to Temperature Limits Established in ZPH, 5/2002 - 8/2002 (pdf)
- Figure 5.9.2-30: Charles River Ambient Temperatures near BU Bridge Compared to Temperature Limits Established in ZPH, 5/2003 - 8/2003 (pdf)
- Figure 5.9.2-31: Charles River Ambient Temperatures near BU Bridge Compared to Temperature Limits Established in ZPH, July 10-15, 1998 (pdf)
- Figure 5.9.2-32: Charles River Ambient Temperatures near BU Bridge Compared to Temperature Limits Established in ZPH, August 13-20, 1998 (pdf)
- Figure 5.9.2-33: Charles River Ambient Temperatures near BU Bridge Compared to Temperature Limits Established in ZPH, June 29 - July 7, 1999 (pdf)
- Figure 5.9.2-34: Charles River Ambient Temperatures near BU Bridge Compared to Temperature Limits Established in ZPH, August 22-25, 2000 (pdf)
- Figure 5.9.2-35: Charles River Ambient Temperatures near BU Bridge Compared to Temperature Limits Established in ZPH, August 6-9, 2001 (pdf)
- Figure 5.9.2-36: Charles River Ambient Temperatures near BU Bridge Compared to Temperature Limits Established in ZPH, July 23 - August 23, 2002 (pdf)
- Figure 5.10.5c-1: Continuous Temperature Data from the BU Bridge and locations near Monitoring Stations 3 and 4, July 23 - August 23, 2002 (pdf)
- Figure 5.10.5c-2: Continuous Temperature Data from the BU Bridge and locations near Monitoring Stations 3 and 4, July 23 - 31, 2002 (pdf)
- Figure 5.10.5c-3: Continuous Temperature Data from the BU Bridge and locations near Monitoring Stations 3 and 4, July 31 - August 8, 2002 (pdf)
- Figure 5.10.5c-4: Continuous Temperature Data from the BU Bridge and locations near Monitoring Stations 3 and 4, August 8 - August 15, 2002 (pdf)
- Figure 5.10.5c-5: Continuous Temperature Data from the BU Bridge and locations near Monitoring Stations 3 and 4, August 16 - August 23, 2002 (pdf)
- Figure 5.11-1 - BTU Loading Approach - Flow Chart (pdf)
- Determination Document Tables:
- Table 2.6-1 MKS List of Finfish Priority Species (pdf)
- Table 5.3-1 MKS historic heat load, compared with projected future maximum heat load and calculated percent (%) increase. (pdf)
- Table 5.6-1 Species Identified as Among the Most Sensitive to Elevated Temperatures: Blueback Herring, Alewife, White Perch, Yellow Perch and White Sucker (pdf)
- Table 5.7.3c-1 Data from Rivers North and South of the Charles River: Alewife Data, Blueback Data, Mixed Species (pdf)
- Table 5.8.1-1 Charles River Temperature Limits by Time of Year in the Zone of Passage and Habitat (pdf)