
Extreme Precipitation
- How Will Climate Change Affect Extreme Precipitation Across the United States?
- Impacts of Extreme Precipitation
- Resources
- References
Extreme precipitation happens when a location receives much more rain or snow during a short period of time than is normal.1 What counts as “extreme” depends on the location and season. For example, some locations might frequently experience two inches of rainfall from a single storm. However, in other places, this amount of rain might be very rare, so it would be considered extreme. In the maps below, extreme precipitation is defined as the top 1% of the heaviest precipitation events for an area given historical records.
Since the 1950s, heavy precipitation events have been happening more often across the contiguous United States, especially in the Northeast and Midwest.2 There is strong evidence that warming due to human activities has contributed to this increase.2 Warmer air temperatures intensify evaporation, which increases the amount of moisture in the air and can fuel more intense precipitation events.1,3
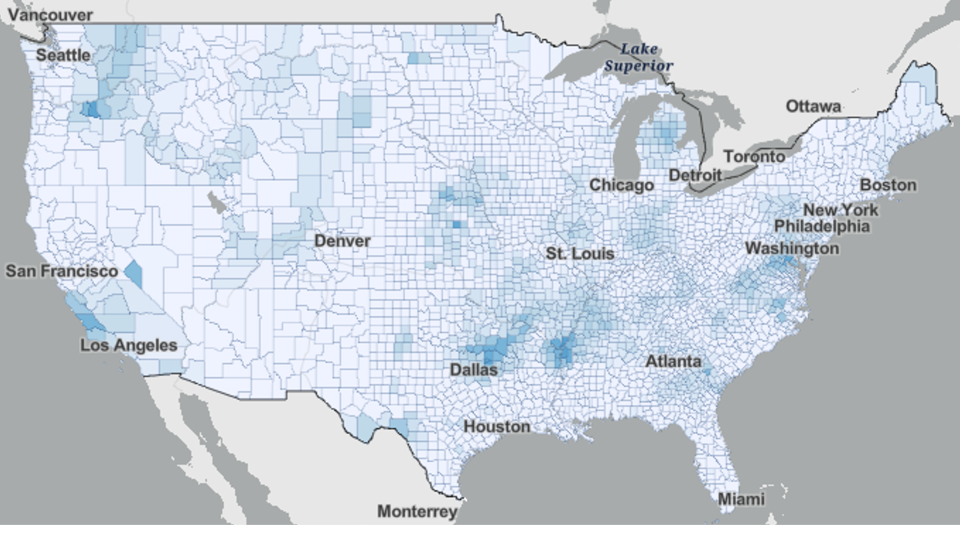
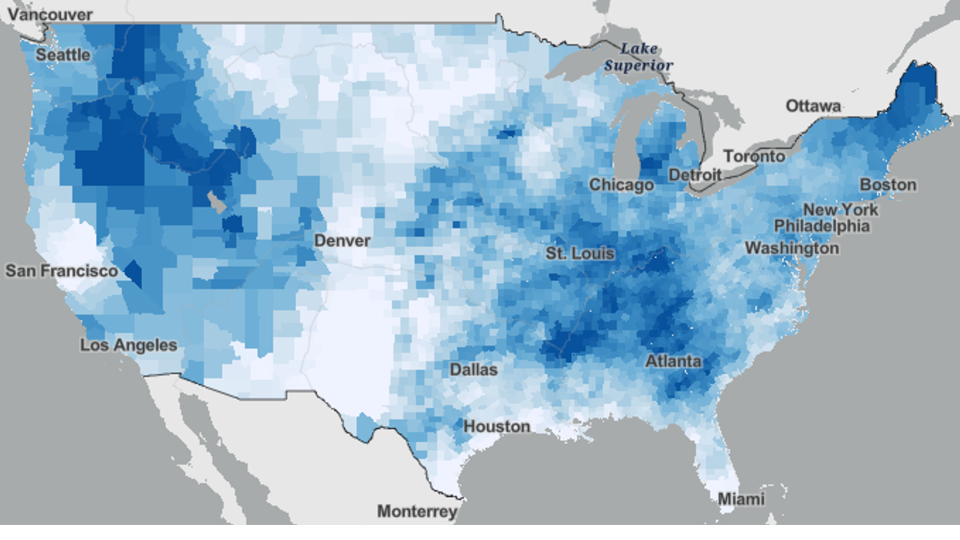
Source: National Climate Assessment Interactive Atlas Explorer.
How Will Climate Change Affect Extreme Precipitation Across the United States?
- As the planet warms, extreme precipitation events are expected to happen more often. Even in regions of the country that are expected to receive less precipitation overall, the precipitation that does fall will come in heavier bursts.4 These heavy bursts can lead to more runoff and raise the risk of flooding. 5
- Changes in extreme precipitation vary by season. Extreme precipitation is expected to increase in spring and winter across the contiguous United States and Alaska.6 While some areas of the country are experiencing drier summers, projected changes in the summer are less certain.6
Impacts of Extreme Precipitation
Continued warming poses risks to many aspects of life, including:
- Human Health
- Stormwater Infrastructure and Water Quality
- Agriculture
- Transportation, Communication, and Energy Infrastructure
Human Health
- More frequent and intense heavy storms can lead to an increase in flooding events. This is especially the case in urban areas that are covered with buildings and pavement that do not soak up as much water as natural areas.7 Agricultural areas can also be more flood-prone as intensive agriculture can reduce how much water soils can absorb.7
- Floodwaters can transport debris, chemicals, bacteria, and other contaminants that are harmful to humans.7 Floodwaters can also contaminate drinking water resources, which can lead to illnesses if the contamination is not removed in treatment.7
- Flooding can disrupt access to health care by blocking roads and damaging healthcare facilities.8
- Homes that have flooded are at risk of developing dangerous levels of mold, which can worsen asthma and other respiratory illnesses.9
- Flooding can result in injuries and deaths, as well as mental health impacts from trauma and displacement.10
- Increases in heavy precipitation events are expected to increase runoff across much of the United States.11 When water cannot be soaked up by the ground and flows over it, it picks up contaminants as it runs over surfaces.
- On farmlands, large amounts of runoff from heavy rain can cause fertilizer to flow into streams and lakes.7 Once in a body of water, these nutrients feed harmful algal blooms and degrade the quality of water bodies that might be used for drinking water or recreation.7
Stormwater Infrastructure and Water Quality
- Heavy precipitation and flooding can overwhelm stormwater systems and affect water quality.
- Many cities in the United States have combined sewer systems that carry wastewater and stormwater in the same pipes. Heavy rain can overwhelm these systems and force them to release untreated wastewater into local water bodies.7,12 These combined sewer overflows, containing raw sewage, debris, and other hazardous substances, can pose risks to people and wildlife.
- Flooding can have disproportionate impacts on infrastructure in underserved communities.13 More than 1,000 community water systems in the United States already experience water quality problems and are not well-prepared for flooding from increased extreme precipitation.14 The communities these systems serve are largely composed of older adults and people who are economically disadvantaged, are Indigenous, or have less education.14
Agriculture
- Heavier rainstorms can undermine agricultural production and disrupt farm operations. These impacts can threaten farmers and farm workers’ livelihoods as well as people who depend on the affected food products.
- Floods can damage crops. Scientists estimate that between 1981 and 2016, high rainfall caused about as much harm to crop yields across the United States as extreme drought did.15
- Healthy soil is crucial for crops to grow. Heavy precipitation can erode topsoil and wash away its nutrients.16
- In some areas, farmers have delayed planting because their fields were too wet from heavy spring rains.16,17
- Changes in the timing and amount of rainfall can reduce the number of days farmworkers can work in the field, impacting livelihoods.18
Transportation, Communication, and Energy Infrastructure Systems
- Heavy precipitation and flooding can damage buildings and infrastructure.
- Runoff and flooding can block or damage roads, bridges, tunnels, and railways—resulting in disruptions and delays.19
- Flooding can affect important digital communication and internet infrastructure.20
- Heavy rain and flooding can disrupt energy supply chains, threaten operations, and damage infrastructure, which can cause power outages.21 Power outages can pose safety risks by disrupting energy to homes and essential services like health care operations. Power outages can also have major economic implications. By 2090, power interruptions in the United States due to climate change could cost over $8 billion per year.21
- In the United States, communities of color, certain immigrant communities, people with low income, and people with limited English proficiency are more likely to live in flood-prone areas.13 These communities are also more likely to live in locations with poorly maintained infrastructure, adding to their risk.13 These inequities are due in part to systemic discriminatory development practices.22 For example, communities with higher percentages of Black residents are projected to experience more annual economic damages from flooding. 23
Resources
- Fifth National Climate Assessment: Human Health (pdf) (2.1 mb)
- Fifth National Climate Assessment: Climate Trends (pdf) (8.1 mb)
- Climate Change and Social Vulnerability in the United States
- Climate Change and Children’s Health and Well-Being in the United States
References
1U.S. EPA. (2024) Climate Change Indicators: Heavy Precipitation. Retrieved 12/11/2024.
2 Marvel, K. et al. (2023) Ch. 2: Climate Trends. Fifth National Climate Assessment. U.S. Global Change Research Program, Washington, DC. doi:10.7930/NCA5.2023.CH2. p. 2-18.
3 Leung, L. R. et al. (2023) Ch. 3: Earth Systems Processes. Fifth National Climate Assessment. U.S. Global Change Research Program, Washington, DC. doi:10.7930/NCA5.2023.CH3. p. 3-22.
4 Marvel, K. et al. (2023) Ch. 2: Climate Trends. Fifth National Climate Assessment. U.S. Global Change Research Program, Washington, DC. doi:10.7930/NCA5.2023.CH2. p. 2-19.
7 Payton, E. A. et al. (2023) Ch. 4: Water. Fifth National Climate Assessment. U.S. Global Change Research Program, Washington, DC. doi:10.7930/NCA5.2023.CH4. p. 4-17.
8Hayden, M. H. et al. (2023) Ch. 15: Human Health. Fifth National Climate Assessment. U.S. Global Change Research Program, Washington, DC. doi:10.7930/NCA5.2023.CH15. p. 15-17.
9 EPA. (2023) Climate Change and Children's Health and Well-Being in the United States. U.S. Environmental Protection Agency, EPA 430-R-23-001. p. 57.
10 EPA. (2023) Climate Change and Children's Health and Well-Being in the United States. U.S. Environmental Protection Agency, EPA 430-R-23-001. p. 58.
11 Payton, E. A. et al. (2023) Chapter 4: Water. Fifth National Climate Assessment. U.S. Global Change Research Program, Washington, DC. doi:10.7930/NCA5.2023.CH4. p. 4-11.
12 EPA. (2022) Climate Change Impacts on the Built Environment. Retrieved 12/11/2024.
13 EPA. (2021) Climate Change and Social Vulnerability in the United States: A Focus on Six Impacts. p. 69.
14Payton, E. A. et al. (2023) Chapter 4: Water. Fifth National Climate Assessment. U.S. Global Change Research Program, Washington, DC. doi:10.7930/NCA5.2023.CH4. p. 4-22.
15 Thornton, P. E. et al. (2023) Ch. 6: Land Cover and Land-Use Change. Fifth National Climate Assessment. U.S. Global Change Research Program, Washington, DC. doi:10.7930/NCA5.2023.CH6. p. 6-11.
16 Wilson, A. B. et al. (2023) Ch. 24: Midwest. Fifth National Climate Assessment. U.S. Global Change Research Program, Washington, DC. doi:10.7930/NCA5.2023.CH24. p. 24- 7.
17 Whitehead, J. C. et al. (2023) Ch. 21: Northeast. Fifth National Climate Assessment. U.S. Global Change Research Program, Washington, DC. doi:10.7930/NCA5.2023.CH21. p. 21-8.
18 Walsh, M. et al. (2020) Climate Indicators for Agriculture. U.S. Department of Agriculture. USDA Technical Bulletin 1953. Washington, DC. https://doi.org/10.25675/10217/210930. p. 8.
19 Liban, C. B. et al. (2023) Ch. 13: Transportation. Fifth National Climate Assessment. U.S. Global Change Research Program, Washington, DC. doi:10.7930/NCA5.2023.CH13. p. 13-8.
20 Chu, E. K. et al. (2023) Ch. 12: Built Environment, Urban Systems, and Cities. Fifth National Climate Assessment. U.S. Global Change Research Program, Washington, DC. doi:10.7930/NCA5.2023.CH12. p. 12-12.
21 Zamuda, C. D. et al. (2023) Ch. 5: Energy Supply, Delivery, and Demand. Fifth National Climate Assessment. U.S. Global Change Research Program, Washington, DC. doi:10.7930/NCA5.2023.CH5. p. 5-6.
22 Chu, E. K. et al. (2023) Ch. 12: Built Environment, Urban Systems, and Cities. Fifth National Climate Assessment. U.S. Global Change Research Program, Washington, DC. doi:10.7930/NCA5.2023.CH12. p. 12-13.
23 Payton, E. A. et al. (2023) Chapter 4: Water. Fifth National Climate Assessment. U.S. Global Change Research Program, Washington, DC. doi:10.7930/NCA5.2023.CH4. p. 4-20.