U.S. flag

An official website of the United States government

Here’s how you know

Dot gov

Official websites use .gov
A .gov website belongs to an official government organization in the United States.

HTTPS

Secure .gov websites use HTTPS
A lock (LockA locked padlock) or https:// means you’ve safely connected to the .gov website. Share sensitive information only on official, secure websites.

    • Environmental Topics
    • Air
    • Bed Bugs
    • Cancer
    • Chemicals, Toxics, and Pesticide
    • Emergency Response
    • Environmental Information by Location
    • Health
    • Land, Waste, and Cleanup
    • Lead
    • Mold
    • Radon
    • Research
    • Science Topics
    • Water Topics
    • A-Z Topic Index
    • Laws & Regulations
    • By Business Sector
    • By Topic
    • Compliance
    • Enforcement
    • Laws and Executive Orders
    • Regulations
    • Report a Violation
    • Environmental Violations
    • Fraud, Waste or Abuse
    • About EPA
    • Our Mission and What We Do
    • Headquarters Offices
    • Regional Offices
    • Labs and Research Centers
    • Planning, Budget, and Results
    • Organization Chart
    • EPA History

Breadcrumb

  1. Home
  2. Climate Change Science

Causes of Climate Change

 
Graph: Human and Natural Influences on Global Temperature
Human and natural factors both influence the earth’s climate, but the long-term trend observed over the past century can only be explained by the effect of human activities on climate. Source: U.S. Global Change Research Program, Fourth National Climate Assessment, Chapter 2: Our Changing Climate, 2018.

Since the Industrial Revolution, human activities have released large amounts of carbon dioxide and other greenhouse gases into the atmosphere, which has changed the earth’s climate. Natural processes, such as changes in the sun's energy and volcanic eruptions, also affect the earth's climate. However, they do not explain the warming that we have observed over the last century.12

On this page:
  • Human Versus Natural Causes
  • Natural Processes

Human Versus Natural Causes

Scientists have pieced together a record of the earth’s climate by analyzing a number of indirect measures of climate, such as ice cores, tree rings, glacier lengths, pollen remains, and ocean sediments, and by studying changes in the earth’s orbit around the sun.3,4 This record shows that the climate varies naturally over a wide range of time scales, but this variability does not explain the observed warming since the 1950s. Rather, it is extremely likely (> 95%) that human activities have been the dominant cause of that warming.5,6

It is unequivocal that human influence has warmed the atmosphere, ocean and land.

Intergovernmental Panel on Climate Change (2021 Report)7

Human activities have contributed substantially to climate change through:

  • Greenhouse Gas Emissions
  • Reflectivity or Absorption of the Sun's Energy

Heat-trapping Greenhouse Gases And The Earth's Climate


Source: Smithsonian National Museum of Natural History, 2018

Greenhouse Gases

Graph showing concentrations of key greenhouse gases.
This graph shows the increase in atmospheric concentrations of three of the key greenhouse gases over the last 2,000 years. Increases in concentrations of these gases since 1750 are due to human activities in the industrial era. Source: U.S. EPA, Climate Change Indicators in the United States: Atmospheric Concentrations of Greenhouse Gases, 2021.

Concentrations of the key greenhouse gases have all increased since the Industrial Revolution due to human activities. Carbon dioxide, methane, and nitrous oxide concentrations are now more abundant in the earth’s atmosphere than any time in the last 800,000 years.8,9 These greenhouse gas emissions have increased the greenhouse effect and caused the earth’s surface temperature to rise. Burning fossil fuels changes the climate more than any other human activity.

Carbon dioxide: In recent years, human activities have released around 35 billion tons of carbon dioxide into the atmosphere every year.10 Atmospheric carbon dioxide concentrations have increased by more than 40 percent since pre-industrial times, from approximately 280 parts per million (ppm) in the 18th century11 to 419 ppm in 2023.12

Methane: Human activities increased methane concentrations during most of the 20th century to more than 2.5 times the pre-industrial level, from approximately 722 parts per billion (ppb) in the 18th century13 to 1,922 ppb in 2023.14

Nitrous oxide: Nitrous oxide concentrations have risen approximately 20 percent since the start of the Industrial Revolution, with a relatively rapid increase toward the end of the 20th century. Nitrous oxide concentrations have increased from a pre-industrial level of 270 ppb15 to 337 ppb in 2023.16

Additional Resources about Greenhouse Gases

  • Greenhouse Gas Emissions and Removals: more information on greenhouse gas emissions
  • What You Can Do About Climate Change: learn more about actions that you can take to reduce greenhouse gas emissions
  • EPA's Greenhouse Gas Equivalencies Calculator: translate abstract greenhouse gas emissions measurements into concrete terms

Reflectivity or Absorption of the Sun's Energy

Activities such as agriculture, road construction, and deforestation can change the reflectivity of the earth's surface, leading to local warming or cooling. This effect is observed in heat islands, which are urban centers that are warmer than the surrounding, less populated areas. One reason that these areas are warmer is that buildings, pavement, and roofs tend to reflect less sunlight than natural surfaces. While deforestation can increase the earth's reflectivity globally by replacing dark trees with lighter surfaces such as crops, the net effect of all land-use changes appears to be a small cooling.17

Emissions of small particles, known as aerosols, into the air can also lead to reflection or absorption of the sun's energy. Many types of air pollutants undergo chemical reactions in the atmosphere to create aerosols. Overall, human-generated aerosols have a net cooling effect on the earth. Learn more about human-generated and natural aerosols.


Natural Processes

Natural processes are always influencing the earth’s climate and can explain climate changes prior to the Industrial Revolution in the 1700s. However, recent climate changes cannot be explained by natural causes alone.

Changes in the Earth’s Orbit and Rotation

Changes in the earth’s orbit and its axis of rotation have had a big impact on climate in the past. For example, the amount of summer sunshine on the Northern Hemisphere, which is affected by changes in the planet’s orbit, appears to be the primary cause of past cycles of ice ages, in which the earth has experienced long periods of cold temperatures (ice ages), as well as shorter interglacial periods (periods between ice ages) of relatively warmer temperatures.18  At the coldest part of the last glacial period (or ice age), the average global temperature was about 11°F colder than it is today. At the peak of the last interglacial period, however, the average global temperature was at most 2°F warmer than it is today.19

Variations in Solar Activity

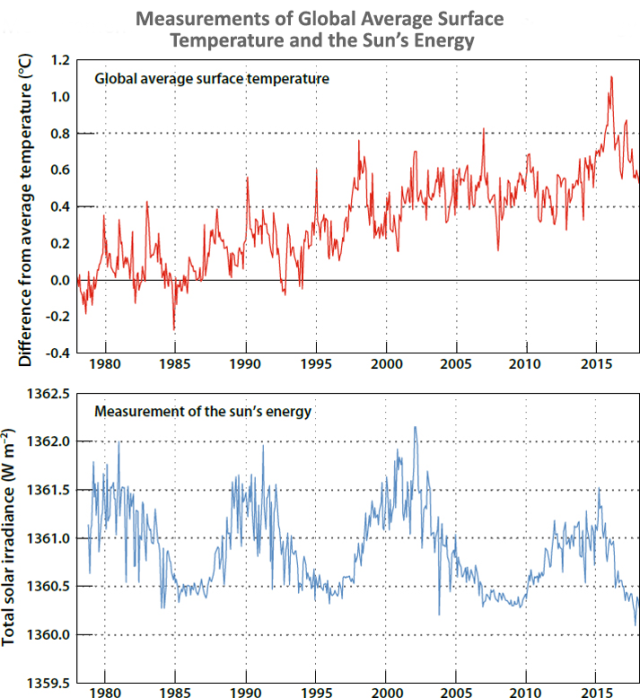
Changes in the sun’s energy output can affect the intensity of the sunlight that reaches the earth’s surface. While these changes can influence the earth’s climate, solar variations have played little role in the climate changes observed in recent decades.20 Satellites have been measuring the amount of energy the earth receives from the sun since 1978. These measurements show no net increase in the sun’s output, even as global surface temperatures have risen.21

Measurements of Global Average Surface Temperature and the Sun’s Energy
The sun follows a natural 11-year cycle of small ups and downs in intensity (bottom chart), but the effect on the earth is small. Over the same period, the average global temperature has increased markedly (top chart). Source: National Academy of Sciences, Climate Change Evidence & Causes (pdf) (4 MB), 2020. 

Changes in the Earth’s Reflectivity

The amount of sunlight that is absorbed or reflected by the planet depends on the earth’s surface and atmosphere. Dark objects and surfaces, like the ocean, forests, and soil, tend to absorb more sunlight. Light-colored objects and surfaces, like snow and clouds, tend to reflect sunlight. About 70 percent of the sunlight that reaches the earth is absorbed.22 Natural changes in the earth’s surface, like the melting of sea ice, have contributed to climate change in the past, often acting as feedbacks to other processes.

Volcanic Activity

Volcanoes have played a noticeable role in climate, and volcanic eruptions released large quantities of carbon dioxide in the distant past. Some explosive volcano eruptions can throw particles (e.g., SO2) into the upper atmosphere, where they can reflect enough sunlight back to space to cool the surface of the planet for several years.23 These particles are an example of cooling aerosols.

Volcanic particles from a single eruption do not produce long-term climate change because they remain in the atmosphere for a much shorter time than greenhouse gases. In addition, human activities emit more than 100 times as much carbon dioxide as volcanoes each year.24

Changes in Naturally Occurring Carbon Dioxide Concentrations

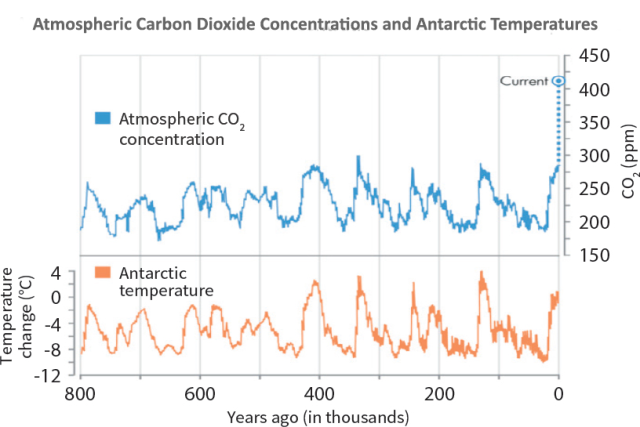
Over the last several hundred thousand years, carbon dioxide levels varied in tandem with the glacial cycles. During warm interglacial periods, carbon dioxide levels were higher. During cool glacial periods, carbon dioxide levels were lower.25 The heating or cooling of the earth’s surface and oceans can cause changes in the natural sources and sinks of these gases, and thus change greenhouse gas concentrations in the atmosphere.26 These changing concentrations have acted as a positive climate feedback, amplifying the temperature changes caused by long-term shifts in the earth’s orbit.27

A graph of atmospheric carbon dioxide concentrations.
Analyses of ice core data extending back 800,000 years show that warmer periods on the earth coincide with periods of relatively high atmospheric carbon dioxide concentrations. Source: Based on data appearing in NAS, Climate Change Evidence & Causes (pdf) (4 MB), 2020.

1 National Academy of Sciences. (2020). Climate change: Evidence and causes: Update 2020. The National Academies Press, Washington, DC, p. 5. doi: 10.17226/25733

2 Marvel, K., W. Su, R. Delgado, S. Aarons, A. Chatterjee, M.E. Garcia, Z. Hausfather, K. Hayhoe, D.A. Hence, E.B. Jewett, A. Robel, D. Singh, A. Tripati, and R.S. Vose, 2023: Ch. 2: Climate Trends. In: Fifth National Climate Assessment. Crimmins, A.R., C.W. Avery, D.R. Easterling, K.E. Kunkel, B.C. Stewart, and T.K. Maycock, Eds. U.S. Global Change Research Program, Washington, DC, USA. 

3 Wuebbles, D.J., D.W. Fahey, K.A. Hibbard, B. DeAngelo, S. Doherty, K. Hayhoe, R. Horton, J.P. Kossin, P.C. Taylor, A.M. Waple & C.P. Weaver. (2017). Executive summary. In: Climate science special report: Fourth national climate assessment, volume I [Wuebbles, D.J., D.W. Fahey, K.A. Hibbard, D.J. Dokken, B.C. Stewart & T.K. Maycock (eds.)]. U.S. Global Change Research Program, Washington, DC, pp. 12–34, doi: 10.7930/J0DJ5CTG

4 National Academy of Sciences. (2020). Climate change: Evidence and causes: Update 2020. The National Academies Press, Washington, DC, pp. 3-5. doi: 10.17226/25733

5 IPCC (2013). Climate change 2013: The physical science basis. Working Group I contribution to the fifth assessment report of the Intergovernmental Panel on Climate Change [Stocker, T.F., D. Qin, G.-K. Plattner, M. Tignor, S.K. Allen, J. Boschung, A. Nauels, Y. Xia, V. Bex & P.M. Midgley (eds.)]. Cambridge University Press, Cambridge, United Kingdom and New York, NY, p. 869.

6 Marvel, K., W. Su, R. Delgado, S. Aarons, A. Chatterjee, M.E. Garcia, Z. Hausfather, K. Hayhoe, D.A. Hence, E.B. Jewett, A. Robel, D. Singh, A. Tripati, and R.S. Vose, 2023: Ch. 2: Climate Trends. In: Fifth National Climate Assessment. Crimmins, A.R., C.W. Avery, D.R. Easterling, K.E. Kunkel, B.C. Stewart, and T.K. Maycock, Eds. U.S. Global Change Research Program, Washington, DC, USA. p. 2-4

7 IPCC. (2021). Climate change 2021: The physical science basis (pdf) (242 MB). Working Group I contribution to the sixth assessment report of the Intergovernmental Panel on Climate Change [Masson-Delmotte, V., P. Zhai, A. Pirani, S.L. Connors, C. Péan, S. Berger, N. Caud, Y. Chen, L. Goldfarb, M.I. Gomis, M. Huang, K. Leitzell, E. Lonnoy, J.B.R. Matthews, T.K. Maycock, T. Waterfield, O. Yelekçi, R. Yu & B. Zhou (eds.)]. Cambridge University Press, Cambridge, United Kingdom, p. SPM-5.

8 Fahey, D.W., S.J. Doherty, K.A. Hibbard, A. Romanou & P.C. Taylor. (2017). Physical drivers of climate change. In: Climate science special report: Fourth national climate assessment, volume I [Wuebbles, D.J., D.W. Fahey, K.A. Hibbard, D.J. Dokken, B.C. Stewart & T.K. Maycock (eds.)]. U.S. Global Change Research Program, Washington, DC, p. 80, Figure 2.4. doi: 10.7930/J0513WCR (pdf) (4 MB)

9 Jay, A.K. et al. (2023). Ch. 1: Overview. Fifth National Climate Assessment. U.S. Global Change Research Program, Washington, DC, p. 1-17.

10 IEA (2024), CO2 Emissions in 2023, IEA, Paris. https://www.iea.org/reports/co2-emissions-in-2023

11 IPCC. (2013). Climate change 2013: The physical science basis. Working Group I contribution to the fifth assessment report of the Intergovernmental Panel on Climate Change [Stocker, T.F., D. Qin, G.-K. Plattner, M. Tignor, S.K. Allen, J. Boschung, A. Nauels, Y. Xia, V. Bex & P.M. Midgley (eds.)]. Cambridge University Press, Cambridge, United Kingdom, and New York, NY, p. 166.

12 Lan, X., Tans, P. and K.W. Thoning: Trends in globally-averaged CO2 determined from NOAA Global Monitoring Laboratory measurements. Version 2024-11 https://doi.org/10.15138/9N0H-ZH07. Retrieved 11/7/2024 from globally averaged marine surface annual mean data.

13 IPCC. (2013). Climate change 2013: The physical science basis.Working Group I contribution to the fifth assessment report of the Intergovernmental Panel on Climate Change [Stocker, T.F., D. Qin, G.-K. Plattner, M. Tignor, S.K. Allen, J. Boschung, A. Nauels, Y. Xia, V. Bex & P.M. Midgley (eds.)]. Cambridge University Press, Cambridge, United Kingdom, and New York, NY, p. 167.

14 Lan, X., K.W. Thoning, and E.J. Dlugokencky: Trends in globally-averaged CH4, N2O, and SF6 determined from NOAA Global Monitoring Laboratory measurements (Global CH4 Monthly Means). Version 2024-11, https://doi.org/10.15138/P8XG-AA10. Retrieved 11/7/2024 from globally averaged marine surface annual mean data.

15 IPCC. (2013). Climate change 2013: The physical science basis. Working Group I contribution to the fifth assessment report of the Intergovernmental Panel on Climate Change [Stocker, T.F., D. Qin, G.-K. Plattner, M. Tignor, S.K. Allen, J. Boschung, A. Nauels, Y. Xia, V. Bex & P.M. Midgley (eds.)]. Cambridge University Press, Cambridge, United Kingdom, and New York, NY, p. 168.

16 Lan, X., K.W. Thoning, and E.J. Dlugokencky: Trends in globally-averaged CH4, N2O, and SF6 determined from NOAA Global Monitoring Laboratory measurements (Global N2O Monthly Means). Version 2024-11, https://doi.org/10.15138/P8XG-AA10. Retrieved 11/7/2024  from globally averaged marine surface annual mean data.

17 Fahey, D.W., S.J. Doherty, K.A. Hibbard, A. Romanou & P.C. Taylor. (2017). Physical drivers of climate change. In: Climate science special report: Fourth national climate assessment, volume I [Wuebbles, D.J., D.W. Fahey, K.A. Hibbard, D.J. Dokken, B.C. Stewart & T.K. Maycock (eds.)]. U.S. Global Change Research Program, Washington, DC, p. 78, Fig. 2.3 and p. 86. doi: 10.7930/J0513WCR (pdf) (4 MB)

18 National Academy of Sciences. (2020). Climate change: Evidence and causes: Update 2020. The National Academies Press, Washington, DC, p. 9. doi: 10.17226/25733

19 Fahey, D.W., S.J. Doherty, K.A. Hibbard, A. Romanou & P.C. Taylor. (2017). Our globally changing climate. In: Climate science special report: Fourth national climate assessment, volume I [Wuebbles, D.J., D.W. Fahey, K.A. Hibbard, D.J. Dokken, B.C. Stewart & T.K. Maycock (eds.)]. U.S. Global Change Research Program, Washington, DC, p. 53. doi: 10.7930/J08S4N35

20Leung, L.R. et al. (2023). Ch. 3: Earth Systems Processes. Fifth National Climate Assessment. U.S. Global Change Research Program, Washington, DC, p. 3-5.

21 National Academy of Sciences. (2020). Climate change: Evidence and causes: Update 2020. The National Academies Press, Washington, DC, p. 7. doi: 10.17226/25733

22 Fahey, D.W., S.J. Doherty, K.A. Hibbard, A. Romanou, & P.C. Taylor. (2017). Physical drivers of climate change. In: Climate science special report: Fourth national climate assessment, volume I [Wuebbles, D.J., D.W. Fahey, K.A. Hibbard, D.J. Dokken, B.C. Stewart & T.K. Maycock (eds.)]. U.S. Global Change Research Program, Washington, DC, p. 2. doi: 10.7930/J0513WCR (pdf) (4 MB)

23 Fahey, D.W., S.J. Doherty, K.A. Hibbard, A. Romanou, & P.C. Taylor. (2017). Physical drivers of climate change. In: Climate science special report: Fourth national climate assessment, volume I [Wuebbles, D.J., D.W. Fahey, K.A. Hibbard, D.J. Dokken, B.C. Stewart & T.K. Maycock (eds.)]. U.S. Global Change Research Program, Washington, DC, p. 79. doi: 10.7930/J0513WCR (pdf) (4 MB)

24 Fahey, D.W., S.J. Doherty, K.A. Hibbard, A. Romanou & P.C. Taylor. (2017). Physical drivers of climate change. In: Climate science special report: Fourth national climate assessment, volume I [Wuebbles, D.J., D.W. Fahey, K.A. Hibbard, D.J. Dokken, B.C. Stewart & T.K. Maycock (eds.)]. U.S. Global Change Research Program, Washington, DC, p. 79. doi: 10.7930/J0513WCR (pdf) (4 MB)

25 National Academy of Sciences. (2020). Climate change: Evidence and causes: Update 2020. The National Academies Press, Washington, DC, pp. 9–10. doi: 10.17226/25733

26 IPCC. (2013). Climate change 2013: The physical science basis. Working Group I contribution to the fifth assessment report of the Intergovernmental Panel on Climate Change [Stocker, T.F., D. Qin, G.-K. Plattner, M. Tignor, S.K. Allen, J. Boschung, A. Nauels, Y. Xia, V. Bex & P.M. Midgley (eds.)]. Cambridge University Press, Cambridge, United Kingdom and New York, NY, p. 399.

27 National Academy of Sciences. (2020). Climate change: Evidence and causes: Update 2020. The National Academies Press, Washington, DC, pp. 9–10. doi: 10.17226/25733

Climate Change Science

  • Basics
  • Causes
  • Impacts
  • Future of Climate Change
    • Extreme Heat
    • Extreme Precipitation
  • Frequently Asked Questions
Contact Us About Climate Change Science
Contact Us to ask a question, provide feedback, or report a problem.
Last updated on March 25, 2025
  • Assistance
  • Spanish
  • Arabic
  • Chinese (simplified)
  • Chinese (traditional)
  • French
  • Haitian Creole
  • Korean
  • Portuguese
  • Russian
  • Tagalog
  • Vietnamese
United States Environmental Protection Agency

Discover.

  • Accessibility Statement
  • Budget & Performance
  • Contracting
  • EPA www Web Snapshot
  • Grants
  • No FEAR Act Data
  • Plain Writing
  • Privacy
  • Privacy and Security Notice

Connect.

  • Data
  • Inspector General
  • Jobs
  • Newsroom
  • Regulations.gov
  • Subscribe
  • USA.gov
  • White House

Ask.

  • Contact EPA
  • EPA Disclaimers
  • Hotlines
  • FOIA Requests
  • Frequent Questions
  • Site Feedback

Follow.