
GenRA Manual: User-Defined Neighborhoods
User-Defined Neighborhoods
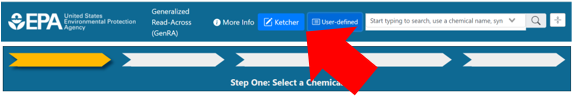
For users who have already identified their own source analogues based on personal criteria but wish to view data availability for the chemical neighborhood, GenRA allows the use of user-defined neighborhoods. To use this feature, select the “User-defined” button next to the chemical search bar (Figure 5).
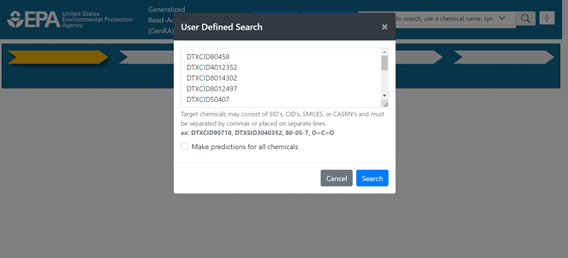
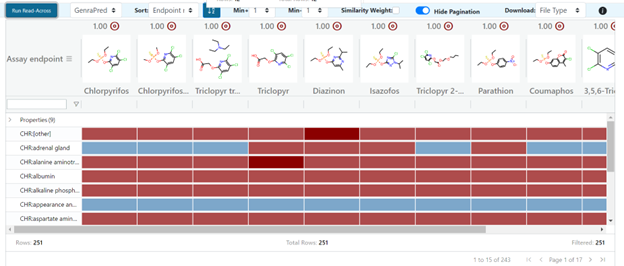
Selection of the button will open a pop-up window, into which a list of chemicals should be passed. List items can be separated by commas or placed on individual lines, and can be presented as DTXCIDs, DTXSIDs, CASRNs, or SMILES (Figure 6). Selection of the “Make predictions for all chemicals” check-box will affect Panel 4 in the workflow, where “Run read-across” will use the user-defined neighborhood to produce predictions for all chemicals in the neighborhood (Figure 7). This is more akin to making ‘within category’ predictions. In addition, in Panel 1 the neighborhood shown will have the first listed chemical in both the center of the radial plot and on the perimeter. Alternatively, if this box is not checked the application will consider the first member of the chemical list in the pop-up window input to be the target chemical of the study, and Panel 4 will operate as usual to make predictions for only that target chemical.
User-defined neighborhoods will consider all chemicals in the neighborhood to be equidistant from one another, with similarity scores of 1 assigned to all chemical pairs. User-defined neighborhoods override the “Neighbors by” and “Filter by” options, so the standard fingerprint and filter options will be unavailable until a new, individual chemical search is performed.
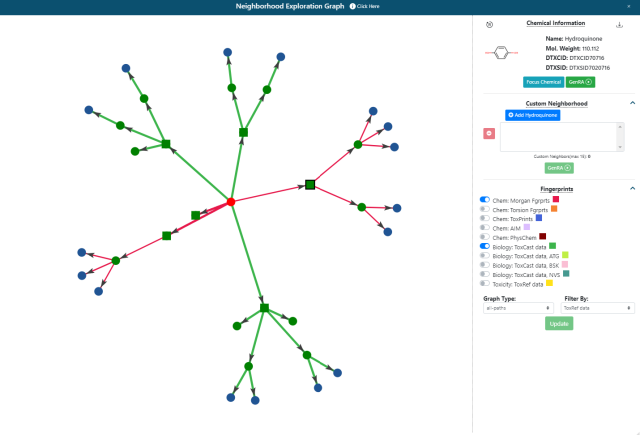
Custom neighborhoods can also be derived by selecting chemicals within the Neighborhood Exploration graph tool that can be accessed from the radial plot in Panel 1. To start a custom neighborhood, a chemical needs to be selected within the graph as shown in Figure 8. The neighborhood of source analogues for Bisphenol A characterized by Morgan and ToxCast fingerprints is shown but where Hydroquinone has been selected as a direct source analogue.
This triggers the appearance of a ‘Custom Neighborhood’ option as seen on the right hand side of the panel in Figure 8. Analogues can be added to the box below to create a new neighborhood. Bisphenol A as the original target chemical will still remain as the target. Once a set of analogues are selected, pressing the green GenRA button will return the user to Panel 1’s radial plot with the chosen set of neighbors. Note all chemicals in the neighborhood will be equidistant from one another, with similarity scores of 1 assigned to all chemical pairs. Selecting the Next button will continue the GenRA workflow as usual.
New Data Sources
ToxVal DCAP
In Version 3.4, a new dataset named ToxVal DCAP was introduced.
ToxVal makes reference to the Toxicity Values database (ToxValDB) that is described elsewhere. DCAP is the Database Calibrated Assessment Product. Briefly, DCAP builds on the published framework developed by Aurisano et al., 2023, who proposed a method for estimating and calibrating dose-response summary values. This framework leveraged the World Health Organization (WHO) framework for quantifying specific uncertainties in hazard characterization. Leveraging both frameworks allows for a transparent and robust approach to toxicity value determination. The DCAP uses the Toxicity Value Database (ToxValDB) to inform development of toxicity values for chemicals that lack human health assessments. The process includes record quality control (QC) and processing, candidate dose response summary value (DRSV) conversion, calibration, uncertainty characterization, calibrated point of departure (cPOD) and chronic toxicity value (CTV) derivation, and generation of a DCAP assessment. Briefly source DRSVs were converted to chronic estimated benchmark dose, human equivalent dose (eBMDHED) values. The distribution of chronic eBMDHED values is then fit to a lognormal distribution. The 18.77th percentile of the fitted distribution was determined to be most frequently associated with the POD for expert selected critical effects in human health assessments from select authoritative sources (Harrill et al, 2025). The 18.77th percentile of the eBMDHED distribution is termed the pcalibeBMDHED. For GenRA, the log10 molar values of the pcalibeBMDHED are presented in Panels 3 and 4 to facilitate read-across prediction.
Acute Toxicity Values LD50
In Version 3.4, a new dataset named Acute Toxicity Values LD50 was introduced.
The LD50 (lethal dose 50) of a chemical in rodents refers to the dose of a substance that, when administered to a group of rodents, causes death in 50% of the animals within a certain period. It is expressed as the amount of substance per kilogram of body weight (mg/kg or g/kg). The LD50 value is a measure of a substance's acute toxicity. This dataset comprises LD50 point estimates that were compiled as part of a NICEATM and the EPA National Center for Computational Toxicology (NCCT; now part of the EPA Center for Computational Toxicology & Exposure) effort to collect a large body of rat oral acute toxicity data (see https://ntp.niehs.nih.gov/whatwestudy/niceatm/test-method-evaluations/acute-systemic-tox/models). A subset of this dataset was used to investigate the ability of GenRA to transition from binary estimates of toxicity to potency predictions. The analysis was published in Helman et al (2019). The dataset and the associated analysis were also published as part of the genra-py python package files. In GenRA, the LD50 values in mg/kg are converted to their log10 molar equivalents for the purposes of making a read-across prediction.
Questions/Further information
For further information: contact us at genra.support@epa.gov. This email is provided as the Contact link on the main application page.