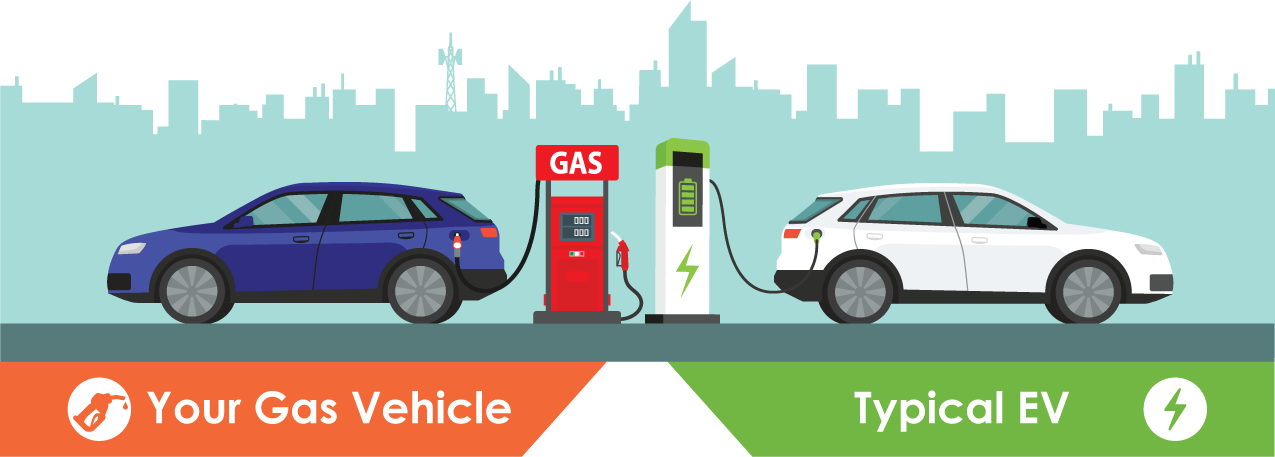
Comparison: Your Car vs. an Electric Vehicle
How does your gasoline vehicle compare to a typical electric vehicle for greenhouse gas emissions?
Input your vehicle’s approximate miles per gallon (MPG) and annual mileage below. Results show annual carbon dioxide (CO2) emissions in metric tons.
Comparison: Your Car vs. an Electric Vehicle
metric tons CO2
metric tons CO2

The results presented are estimates. For a more detailed assessment of total greenhouse gas (GHG) emissions from a specific electric vehicle and a typical gas vehicle using regional grid values, visit Greenhouse Gas Emissions from Electric and Plug-In Hybrid Vehicles.
Assumptions
Total GHG emissions = tailpipe + upstream emissions. Upstream emissions include the GHGs associated with the production and distribution of gasoline and electricity.
- Tailpipe-CO2 Emissions from a gallon of gasoline = 8,887 grams CO2/ gallon
- Upstream-Tailpipe CO2 emissions are multiplied by a national average factor of 1.25 to account for emissions associated with gasoline production, e.g., drilling, refining, and transportation, etc.
For a “typical” electric vehicle: the Model Year 2025 median energy consumption is 39 kWh/100 miles (combined city/hwy) using the national average electricity CO2 emission factor from eGRID 2023.
