
Heat Island Trends
On this page:
Climate change and heat islands interact in important ways. In many areas of the U.S., steadily increasing warming trends are intensifying already higher temperatures in heat island areas. 1, 2 This continued warming is expected to worsen heat islands in the future.3 As urban population densities increase and natural land areas decrease, heat islands will strengthen.3, 4 Communities can address and respond to these trends by taking actions to reduce their local heat islands. For example, strategies such as installing cool roofs and increasing tree canopy can lower heat island temperatures and lessen the exposure and sensitivity of city residents to climate change impacts, while also lowering the greenhouse gas emissions that cause climate change.
This page describes the risks posed by the interplay of climate change and heat islands and highlights the climate change-related benefits of heat island reduction strategies.
Compound Effects of Climate Change and Heat Islands
More and Harsher Heat Waves
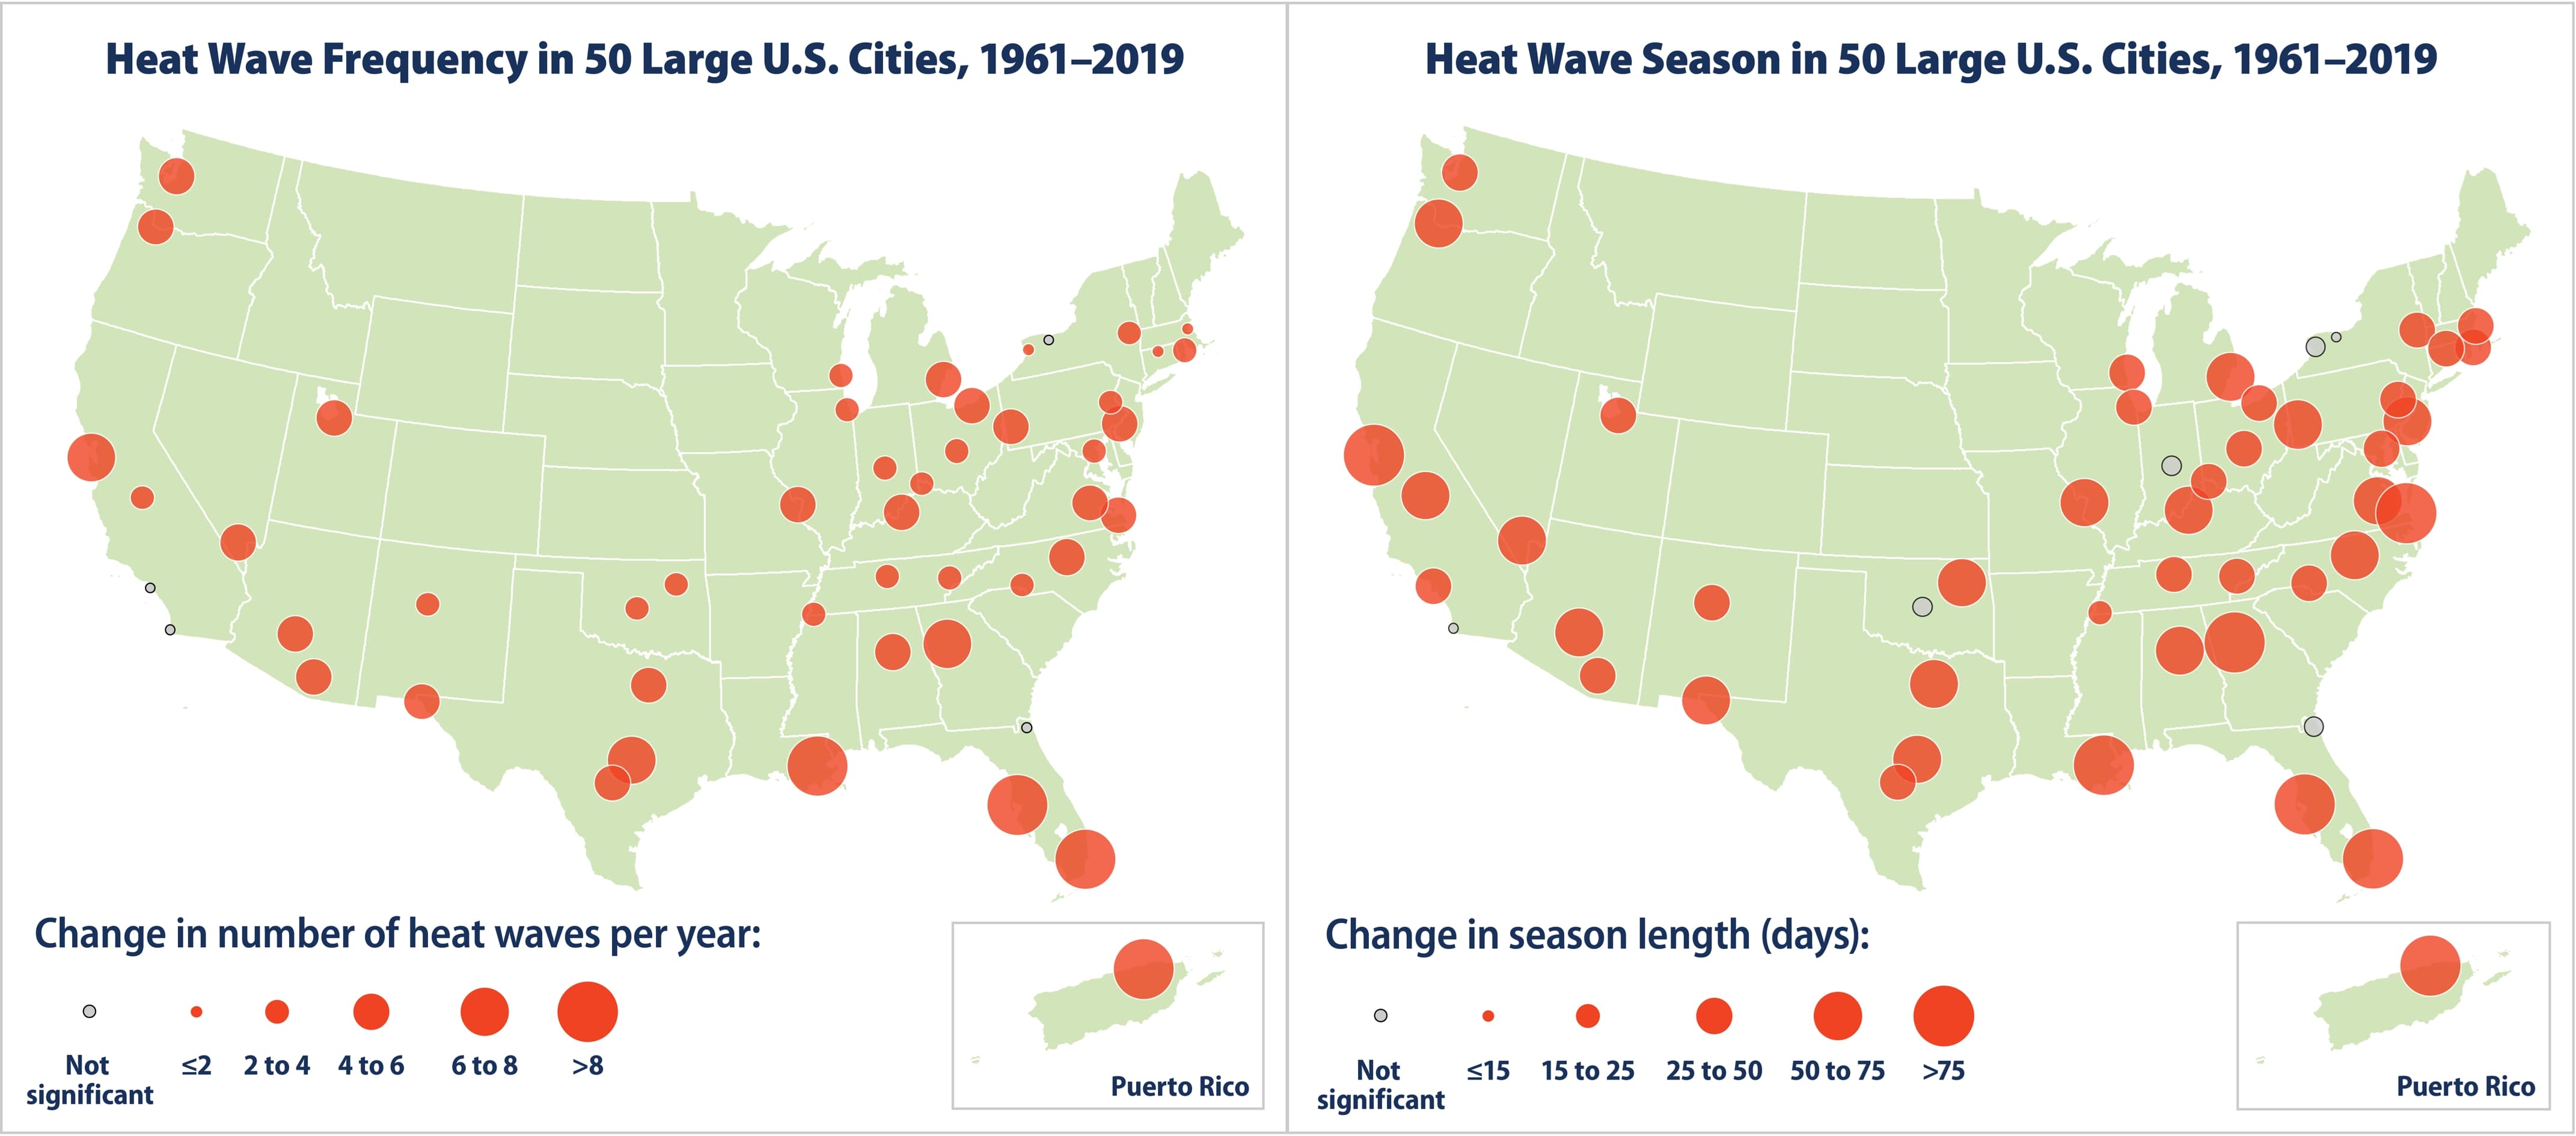
A series of unusually hot days is referred to as an extreme heat event or a heat wave. Annual heat wave counts and heat wave season length have steadily increased in U.S. cities over the past several decades (Figure 1). As global temperatures continue to rise due to climate change, heat wave frequency and severity are expected to continue to increase.5 Areas already impacted by heat islands will likely bear the brunt of these heat waves and their associated harmful health and environmental effects.
![]()
![]()
![]()
These maps represent the number of heat waves per year (frequency) and the number of days between the first and last heat wave of the year (season length) compared with the local temperature threshold for defining a heat wave across 50 U.S. metropolitan areas.6
Increased Health Risks
When people are exposed to extreme heat, they can suffer from potentially deadly illnesses, such as heat exhaustion and heat stroke. Hot temperatures can also contribute to deaths from heart attacks, strokes, and other forms of cardiovascular disease. Extreme heat events strain high-risk populations disproportionately. 7, 8, 9 Older adults, young children, people of color, individuals with low-income, outdoor workers, and people in poor health are the most vulnerable to these impacts. For example, Figure 2 shows the difference in death rates between some of these population groups.
Using 2004–2018 data, the Centers for Disease Control and Prevention recorded 10,527 heat-related deaths in the United States, an average of 702 per year. These numbers include deaths where heat was reported as the underlying cause or a contributing cause.10 The actual number of heat-related deaths may be much higher because the cause of death may not be reported as “heat-related” on death certificates.8 Heat-related illnesses vary by geography, occurring most frequently in the Southeast and Midwest.9 In the future, continued warming and increases in heat-related deaths are projected to outweigh reductions in cold-related deaths in most U.S. regions.11
To learn more about the health impacts of heat exposure, visit these resources:
- Climate Change Indicators: Heat-Related Deaths (U.S. EPA)
- Climate Change Indicators: Heat-Related Illnesses (U.S. EPA)
- Protecting Vulnerable Groups from Extreme Heat (Centers for Disease Control and Prevention)
- Heat Islands Impacts (U.S. EPA)
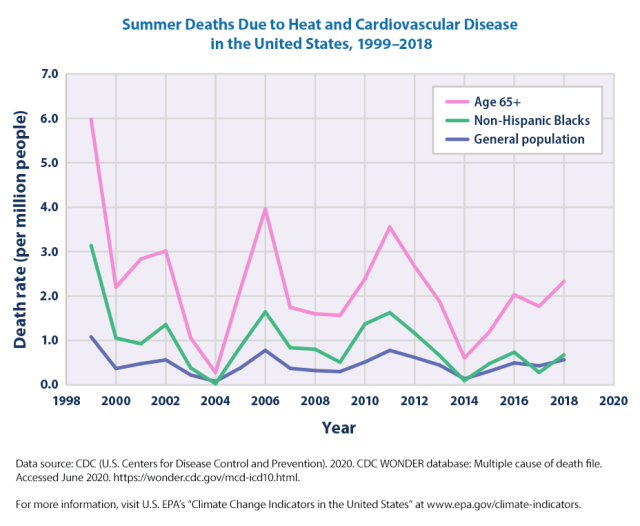
This graph presents summer (May–September) death rates from 1999 to 2018 for three population groups in the United States. The blue line shows rates for the entire population, the green line shows rates for non-Hispanic Black people, and the pink line shows rates for people aged 65 and older.8
Climate Change Benefits of Reducing Heat Islands
Efforts to reduce heat islands can help mitigate climate change. In addition to lowering urban temperatures, heat island reduction strategies lessen electricity demand for air conditioning and thereby reduce the greenhouse gas emissions associated with electricity generation that contribute to climate change. Simultaneously, these measures can help communities become more resilient to climate change impacts. For example:
- Strategies such as planting shade trees or installing cool roofs can lower surface and air temperatures in cities, while reducing the amount of energy needed to cool buildings, resulting in improved reliability of the electric system, particularly during extreme weather events.
- Green roofs and some types of cool pavements can diminish heat islands, while also reducing stormwater runoff and limiting flooding risks during heavy rainstorms. In the same way, increasing the tree canopy helps protect against high winds, erosion, and flooding.
- Smart growth can cool urban areas, while also decreasing dependence on fossil fuel-powered transportation and making it easier for people to get to cooling centers by increasing mobility and walkability and reducing urban sprawl.
- U.S. EPA. 2016. Climate Change Indicators: U.S. and Global Temperature. U.S. Environmental Protection Agency.
- Maxwell, K., S. Julius, A. Grambsch, A. Kosmal, L. Larson, and N. Sonti. 2018. Built environment, urban systems, and cities. In Impacts, Risks, and Adaptation in the United States: Fourth National Climate Assessment, Volume II (D.R. Reidmiller, C.W. Avery, D.R. Easterling, K.E. Kunkel, K.L.M. Lewis, T.K. Maycock, and B.C. Stewart [eds.]). U.S. Global Change Research Program, Washington, DC. pp. 438–478. doi: 10.7930/NCA4.2018.CH11.
- Sleeter, B.M., T. Loveland, G. Domke, N. Herold, J. Wickham, and N. Wood. 2018. Land cover and land-use change. In Impacts, Risks, and Adaptation in the United States: Fourth National Climate Assessment, Volume II (D.R. Reidmiller, C.W. Avery, D.R. Easterling, K.E. Kunkel, K.L.M. Lewis, T.K. Maycock, and B.C. Stewart [eds.]). U.S. Global Change Research Program, Washington, DC. pp. 202–231. doi: 10.7930/NCA4.2018.CH5.
- Hibbard, K.A., F.M. Hoffman, D. Huntzinger, and T.O. West. 2017. Changes in land cover and terrestrial biogeochemistry. In Climate Science Special Report: Fourth National Climate Assessment, Volume I (D.J. Wuebbles, D.W. Fahey, K.A. Hibbard, D.J. Dokken, B.C. Stewart, and T.K. Maycock [eds.]). U.S. Global Change Research Program, Washington, DC. pp. 277–302. doi: 10.7930/J0416V6X.
- U.S. EPA. 2021. Climate Change Indicators: Heat Waves. U.S. Environmental Protection Agency.
- U.S. EPA. 2021. Climate Change Indicators: Heat Waves. U.S. Environmental Protection Agency.
- Sarofim, M.C., S. Saha, M.D. Hawkins, D.M. Mills, J. Hess, R. Horton, P. Kinney, J. Schwartz, and A. St. Juliana. 2016. Temperature-related death and illness. In The Impacts of Climate Change on Human Health in the United States: A Scientific Assessment. U.S. Global Change Research Program, Washington, DC. pp. 43–68.
- U.S. EPA. 2021. Climate Change Indicators: Heat-Related Deaths. U.S. Environmental Protection Agency.
- U.S. EPA. 2021. Climate Change Indicators: Heat-Related Illnesses. U.S. Environmental Protection Agency.
- Vaidyanathan. A., J. Malilay, P. Schramm, and S. Saha. 2020. Heat-related deaths — United States, 2004–2018. Morbidity and Mortality Weekly Report 69(24):729–734.
- Ebi, K.L., J.M. Balbus, G. Luber, A. Bole, A. Crimmins, G. Glass, S. Saha, M.M. Shimamoto, J. Trtanj, and J.L. White-Newsome. 2018. Human health. In Impacts, Risks, and Adaptation in the United States: Fourth National Climate Assessment, Volume II (D.R. Reidmiller, C.W. Avery, D.R. Easterling, K.E. Kunkel, K.L.M. Lewis, T.K. Maycock, and B.C. Stewart [eds.]). U.S. Global Change Research Program, Washington, DC. pp. 539–571. doi: 10.7930/NCA4.2018.CH14