Climate Change Indicators: Heat-Related Illnesses
This indicator tracks how often people are hospitalized because of exposure to heat.
Key Points
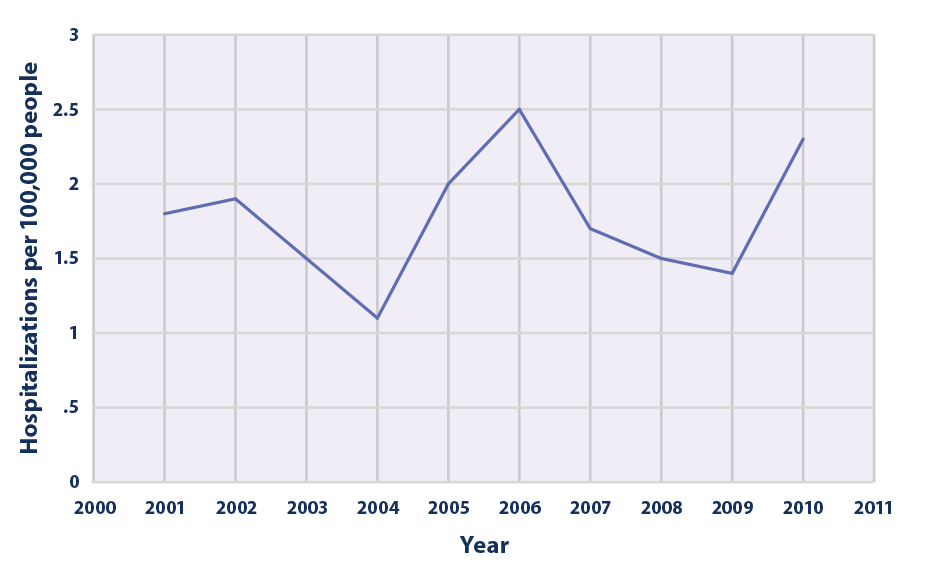
- From 2001 to 2010, the 20 states covered in Figure 1 recorded a total of about 28,000 heat-related hospitalizations.6 The resulting annual rates ranged from 1.1 cases per 100,000 people in 2004 to 2.5 cases per 100,000 people in 2006, with a 10-year average rate of 1.8 cases per 100,000 people (see Figure 1).
- The pattern in Figure 1 largely matches the pattern in heat-related deaths during the same period (see the Heat-Related Deaths indicator), including a low value in 2004 and a peak in 2006. Considerable year-to-year variability makes it difficult to determine whether heat-related illnesses have increased or decreased to a meaningful degree since 2001.
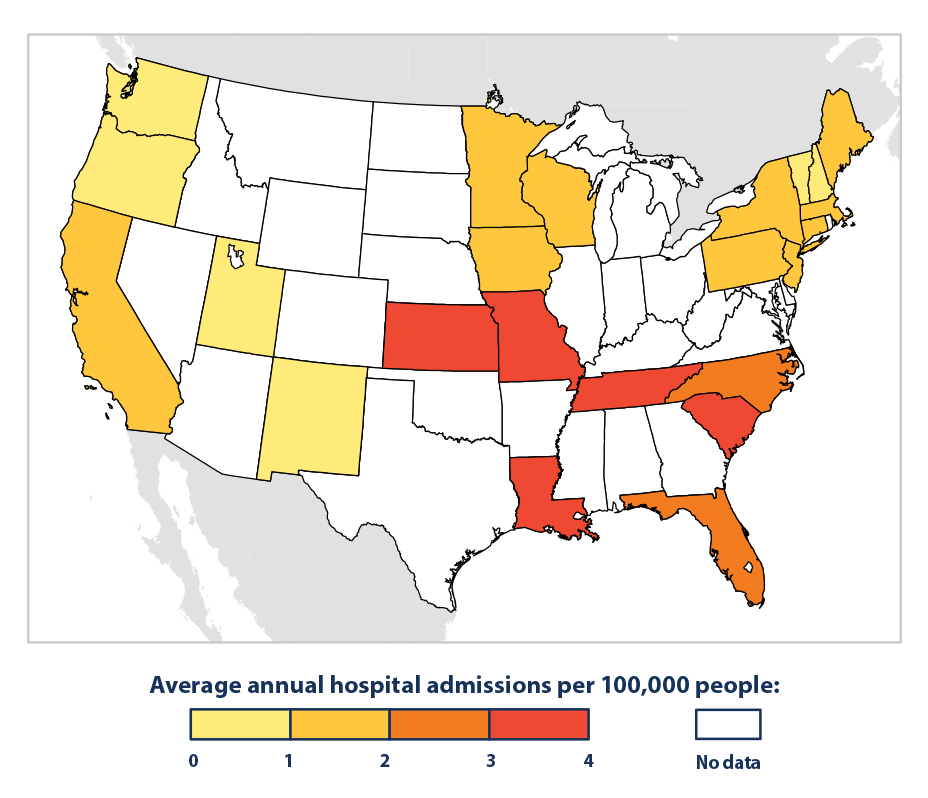
- Heat-related hospitalization rates vary widely among the 23 states studied (see Figure 2). Average rates from 2001 to 2010 ranged from fewer than one case per 100,000 people in some states to nearly four cases per 100,000 people in others. The highest rates occurred in Kansas, Louisiana, Missouri, South Carolina, and Tennessee. Relatively high hospitalization rates in the Southeast and Midwest suggest a connection between hotter and more humid summers and increased rates of heat-related illness, compared with other regions.7
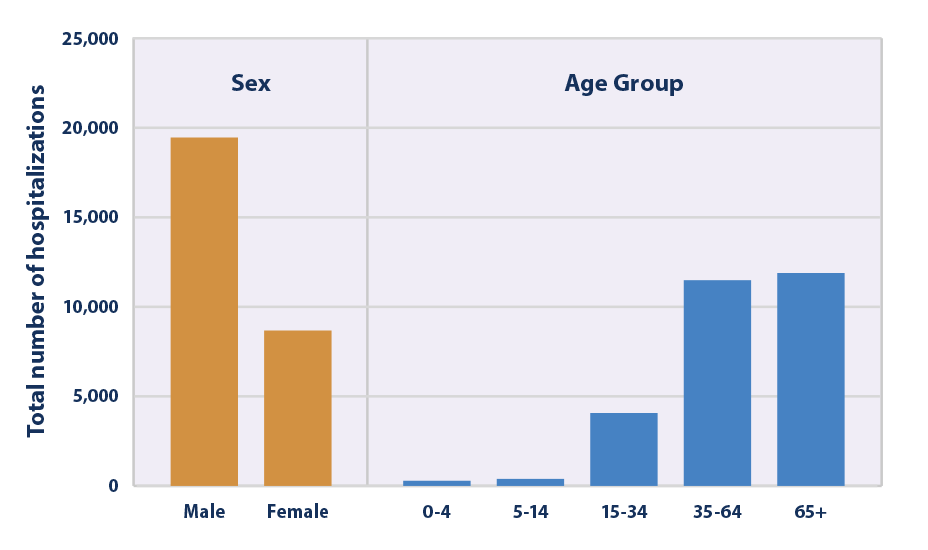
- People aged 65+ accounted for more heat-related hospitalizations than any other age group from 2001 to 2010, and males were hospitalized for heat-related illnesses more than twice as often as females (see Figure 3). Men tend to have a higher risk of heat-related illness than women because they are more likely to work in outdoor occupations such as construction.8
- This indicator could overlook illnesses that were not diagnosed as heat-related, did not result in a hospitalization, or were not fully documented or reported.
Background
Heat-related illnesses can occur when a person is exposed to high temperatures, such that their body cannot cool itself sufficiently through sweating. Symptoms range from mild swelling, rashes, or cramps to potentially deadly heat exhaustion and heat stroke. Heat is the leading weather-related killer in the United States (see the Heat-Related Deaths indicator), and it causes many people to visit the emergency room or be admitted to the hospital.
Any person can suffer from heat stress, regardless of age, sex, or health status. Older adults and children, however, have a higher-than-average risk of becoming ill due to exposure to extreme heat.1 People working outdoors, the socially isolated and economically disadvantaged, those with chronic illnesses, and some communities of color are also especially vulnerable to heat.2
Unusually hot summer temperatures have become more common across the contiguous 48 states in recent decades3 (see the High and Low Temperatures indicator), and extreme heat events (heat waves) are expected to become more frequent and more intense in the future.4 As a result, the risk of heat-related illness is expected to increase.5 Hospitalization rates can also change, however, as people acclimate to higher temperatures and as communities strengthen their heat response plans and take other steps to continue to adapt.
About the Indicator
This indicator shows hospitalization rates for “heat-related” illnesses such as heat exhaustion, heat cramps, mild heat edema (swelling in the legs and hands), heat syncope (fainting), and heat stroke. It is based on hospital discharge records for patients who are admitted to the hospital for 23 hours or more. Every discharge record includes a diagnosis determined by a physician or other medical professional.
This indicator covers states across a wide range of regions and climate zones that have participated in a national hospital data tracking program since at least 2001. All of these states require hospitals to submit discharge data to a state organization, which then compiles and reports the data to the U.S. Centers for Disease Control and Prevention (CDC). Dividing the annual number of hospitalizations by the corresponding state population, then multiplying by 100,000, gives the hospitalization rates (per 100,000 people) shown in this indicator.
Figure 1 shows annual hospitalization rates, averaged over a group of 20 states. Figure 2 shows state-specific rates for 23 states, averaged over the period from 2001 to 2010. Figure 3 shows the total number of hospitalizations across the same 20 states shown in Figure 1, broken out by sex and by age group. Because excessive heat events are associated with summer months, this indicator is limited to hospitalizations occurring in May through September. Reporting of illnesses and processing of records can involve a time lag of several years, so this indicator currently only shows data through 2010.
About the Data
Indicator Notes
Several factors influence this indicator’s ability to estimate the true number of hospitalizations associated with extreme heat events: the indicator is limited to a subset of states; it uses records that have only been collected comprehensively since 2001; it relies on the judgment of thousands of individual medical professionals to accurately diagnose and explicitly document heat-related illnesses; and it assumes that hospitals fulfill their state-mandated reporting obligations. Nonetheless, this data set represents the best available source of observed data for tracking heat-related hospitalizations across multiple states. Focusing exclusively on the months from May 1 to September 30 may help to exclude incorrect reports, but it could also exclude legitimate heat-related illnesses that occur in other months.
Hospitals’ practice of recording heat stress as a diagnosis does not signify that high temperatures are the only factor that causes or contributes to a hospitalization. Pre-existing medical conditions can significantly increase an individual’s vulnerability to heat. Other important factors, such as the overall vulnerability of the population, the extent to which people have adapted and acclimated to higher temperatures, and the local climate and topography, can affect trends in “heat-related” hospitalizations. Heat response measures, such as early warning and surveillance systems, air conditioning, health care, public education, cooling centers, infrastructure standards, and air quality management, can also make a big difference in heat-related hospitalization rates.
Data Sources
Data for this indicator were provided by CDC. This analysis was developed by CDC’s Environmental Public Health Tracking Program, which publishes state-level hospitalization data online at: https://www.cdc.gov/environmental-health-tracking/about/index.html
Technical Documentation
References
1 Sarofim, M.C., S. Saha, M.D. Hawkins, D.M. Mills, J. Hess, R. Horton, P. Kinney, J. Schwartz, and A. St. Juliana. 2016. Chapter 2: Temperature-related death and illness. The impacts of climate change on human health in the United States: A scientific assessment. U.S. Global Change Research Program.
2 Sarofim, M.C., S. Saha, M.D. Hawkins, D.M. Mills, J. Hess, R. Horton, P. Kinney, J. Schwartz, and A. St. Juliana. 2016. Chapter 2: Temperature-related death and illness. The impacts of climate change on human health in the United States: A scientific assessment. U.S. Global Change Research Program.
3 USGCRP (U.S. Global Change Research Program). 2017. Climate science special report: Fourth National Climate Assessment, volume I. Wuebbles, D.J., D.W. Fahey, K.A. Hibbard, D.J. Dokken, B.C. Stewart, and T.K. Maycock, eds. https://repository.library.noaa.gov/view/noaa/19486. doi:10.7930/J0J964J6 .
4 USGCRP (U.S. Global Change Research Program). 2017. Climate science special report: Fourth National Climate Assessment, volume I. Wuebbles, D.J., D.W. Fahey, K.A. Hibbard, D.J. Dokken, B.C. Stewart, and T.K. Maycock, eds. https://repository.library.noaa.gov/view/noaa/19486. doi:10.7930/J0J964J6 .
5 IPCC (Intergovernmental Panel on Climate Change). 2014. Climate change 2014: Impacts, adaptation, and vulnerability. Working Group II contribution to the IPCC Fifth Assessment Report. Cambridge, United Kingdom: Cambridge University Press. https://www.ipcc.ch/report/ar5/wg2.
6 Choudhary, E. and A. Vaidyanathan. 2014. Heat stress illness hospitalizations—Environmental public health tracking program, 20 states, 2001-2010. Surveillance Summaries 63(SS13):1-10. www.cdc.gov/mmwr/preview/mmwrhtml/ss6313a1.htm.
7 Choudhary, E. and A. Vaidyanathan. 2014. Heat stress illness hospitalizations—Environmental public health tracking program, 20 states, 2001-2010. Surveillance Summaries 63(SS13):1-10. www.cdc.gov/mmwr/preview/mmwrhtml/ss6313a1.htm.
8 Choudhary, E. and A. Vaidyanathan. 2014. Heat stress illness hospitalizations—Environmental public health tracking program, 20 states, 2001-2010. Surveillance Summaries 63(SS13):1-10. www.cdc.gov/mmwr/preview/mmwrhtml/ss6313a1.htm.
9 Choudhary, E. and A. Vaidyanathan. 2014. Heat stress illness hospitalizations—Environmental public health tracking program, 20 states, 2001-2010. Surveillance Summaries 63(SS13):1-10. www.cdc.gov/mmwr/preview/mmwrhtml/ss6313a1.htm.
10 CDC (U.S. Centers for Disease Control and Prevention). 2016. Environmental Public Health Tracking Program: Heat stress hospitalizations indicator data. Accessed March 2016. https://ephtracking.cdc.gov/.
11 Choudhary, E. and A. Vaidyanathan. 2014. Heat stress illness hospitalizations—Environmental public health tracking program, 20 states, 2001-2010. Surveillance Summaries 63(SS13):1-10. www.cdc.gov/mmwr/preview/mmwrhtml/ss6313a1.htm.

