Climate Change Indicators: Marine Heat Waves
This indicator tracks the occurrence of unusually high temperatures in U.S. coastal waters.
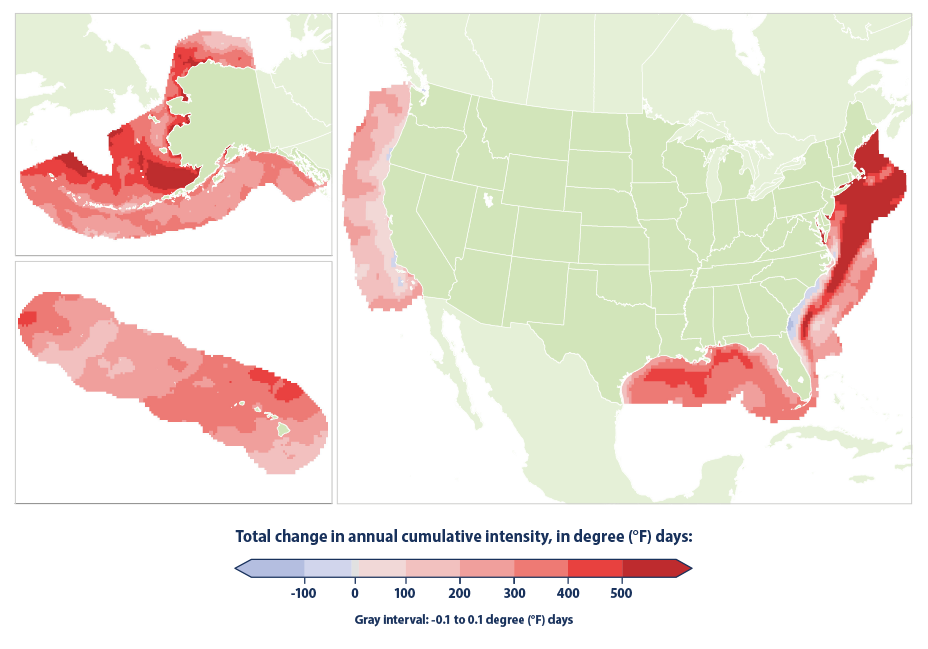
This map shows the change in annual cumulative intensity of marine heat waves along U.S. coasts from 1982 to 2023. Cumulative intensity is measured in degree days—marine heat wave intensity multiplied by duration. Areas with increases are shown in red, with darker colors indicating greater change. The map shows total change, which is the annual rate of change (trend slope) multiplied by the number of years analyzed. The boundaries include the area within the U.S. exclusive economic zone.
Data source: NOAA, 20244
Web update: June 2024
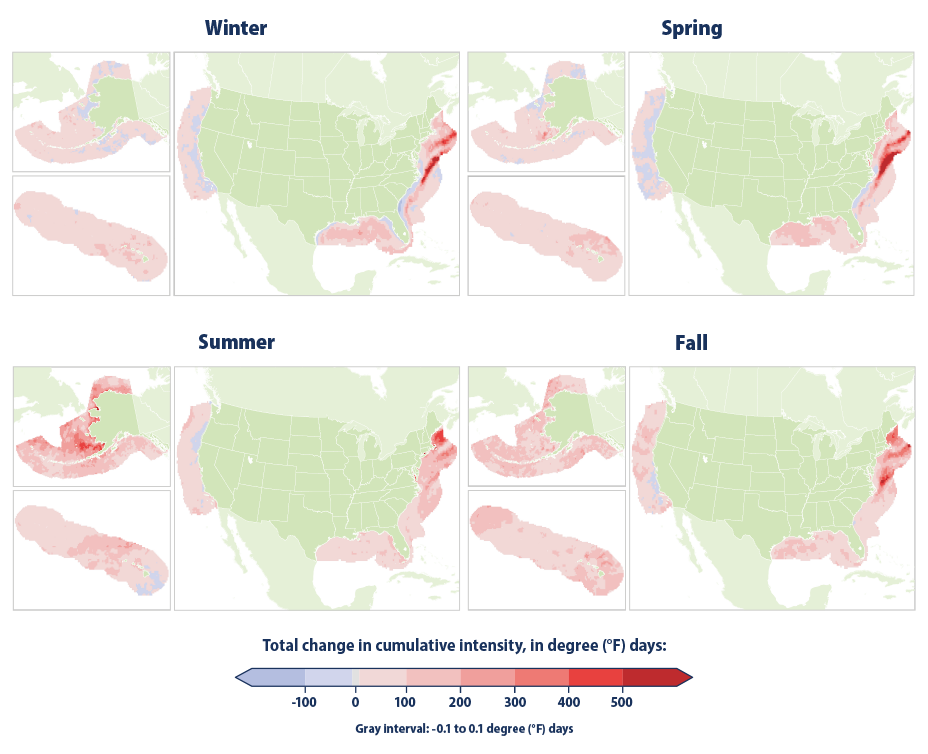
This set of maps shows the change in cumulative intensity of marine heat waves along U.S. coasts from 1982 to 2023 by season. The calculation approach and geographic area are the same as in Figure 1. Seasons are defined as follows: December, January, and February for winter; March, April, and May for spring; June, July, and August for summer; and September, October, and November for fall.
Data source: NOAA, 20244
Web update: June 2024
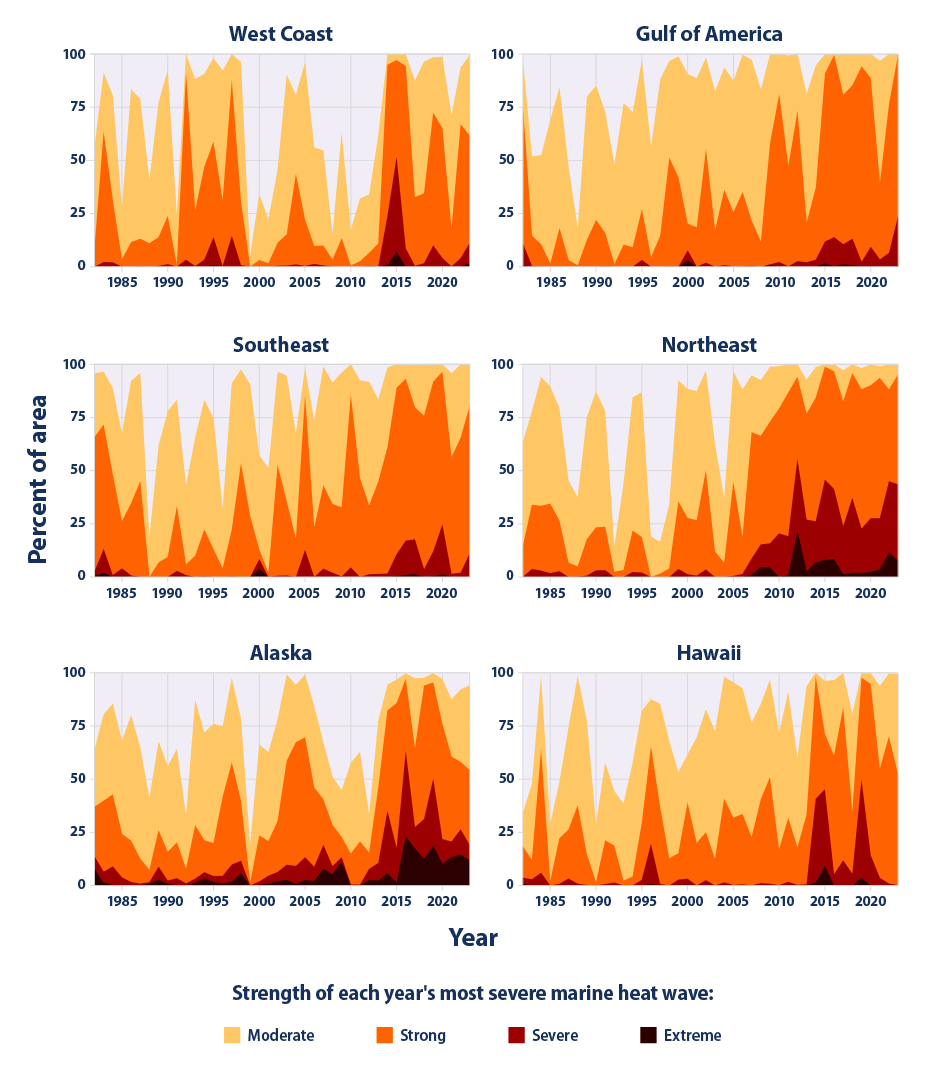
These graphs show the percentage of each coastal region’s area that experienced at least one marine heat wave in a given year. The stacked segments show severity levels (see definitions in the technical documentation) for the most severe heat wave at a location, while the total height of the stack represents the total area that experienced a marine heat wave of any severity. For example, in 2023, 100 percent of the Northeast region experienced at least one heat wave of moderate severity or higher, while 35 percent of the region’s area experienced at least one severe heat wave and 8 percent experienced an extreme heat wave. Data are broken into six regions whose boundaries include the area within the U.S. exclusive economic zone.
Data source: NOAA, 20244
Web update: June 2024
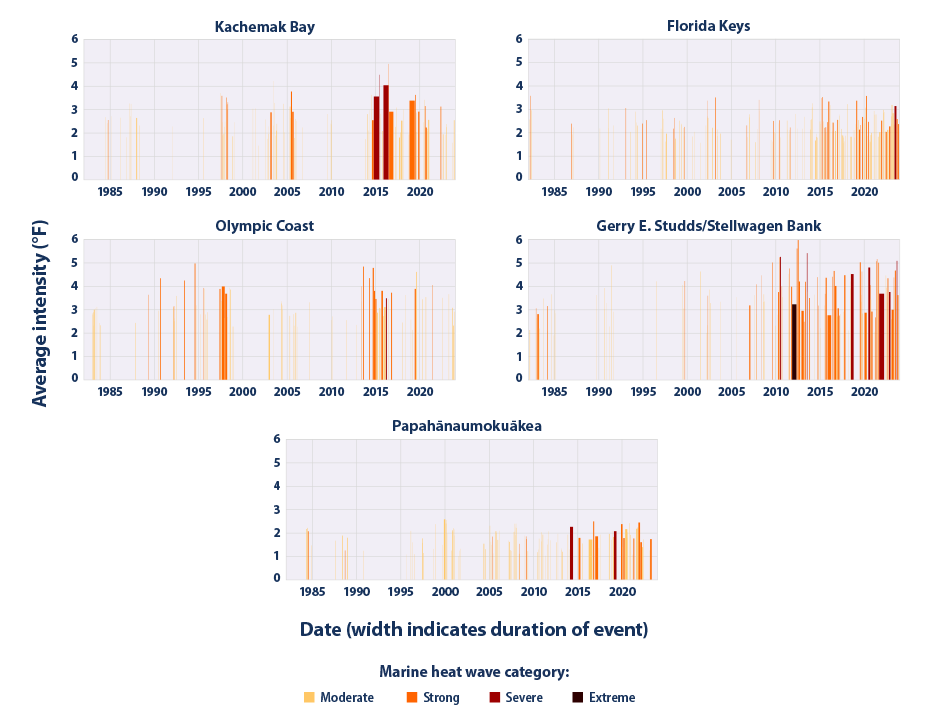
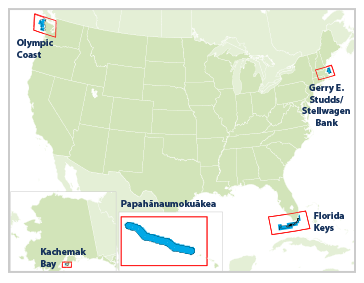
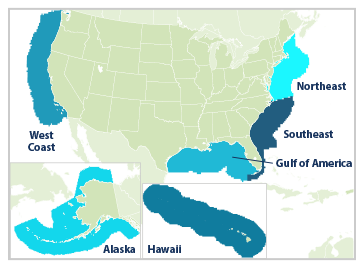
These graphs show a timeline of marine heat wave events for five marine protected areas selected from different parts of the U.S. coastline. The columns in each graph show each individual event’s duration (width of the column), intensity (height), and severity level (color; see definitions in the technical documentation). The distribution of vertical columns reflects the frequency of heat waves. The small map to the right shows the areas analyzed (blue).
Data source: NOAA, 20244
Web update: June 2024
Key Points
- Over the period shown (1982–2023), the annual cumulative intensity of marine heat waves has increased in most coastal U.S. waters, with the largest changes in waters off the northeastern U.S. and Alaskan coasts (Figure 1). Changes were particularly pronounced in the spring in the Northeast and the summer in Alaska (Figure 2).
- Marine heat wave events have become more widespread and more severe in most U.S. coastal regions in recent years (Figure 3). Region-wide changes in the Northeast and Alaska are particularly evident, as are the location-specific changes in frequency, duration, and intensity at marine protected areas in the Northeast, Alaska, and Hawaii (Figure 4).
Background
Temperature is an important physical characteristic of ocean water. As the Sea Surface Temperature indicator explains, the range of temperature conditions plays an important role in determining what species of plants, animals, and microbes can survive or thrive in a particular area. Long-term changes in these temperature ranges can affect ecological communities by shifting species’ geographic distribution (see the Marine Species Distribution indicator), influencing migration and breeding patterns, and ultimately altering habitat and the movement of nutrients.1
Short-term spikes in temperature also pose a concern. Just like heat waves based on air temperature (see the Heat Waves indicator), marine heat waves are an extreme condition that can severely disrupt marine life. This disruption can cause harm as ocean creatures—particularly those that are stationary, like corals—are not able to escape waters that become too warm to tolerate for an extended period. Marine heat waves are associated with some of the largest disruptions to marine life in recent years. For example, persistent marine heat wave conditions in the northern Pacific have fed harmful algal blooms that then led to closures in the Dungeness crab fishery and deaths of sea lions.2
Daily, weekly, and seasonal variation in sea surface temperature is natural. Ocean temperatures can also vary year to year, due to multi-year cycles such as the El Niño–Southern Oscillation. As ocean waters become warmer overall, though, marine heat waves will become more common and more extreme.2,3
About the Indicator
This indicator reports on observed trends in the occurrence and intensity of marine heat waves along U.S. coasts over the past four decades, based on daily sea surface temperature measurements. Sea surface temperature records come from the National Oceanic and Atmospheric Administration and are based on satellite measurements of water temperature, with additional data from buoys and ships providing confirmation and helping to fill occasional gaps in measurement coverage. The indicator starts in 1982, which was the first full year with available satellite data.
For this indicator, a marine heat wave is a period of at least five days in a row in which the sea surface temperature at a given location is hotter than at least 90 percent of past observations at that location on that particular day of the year. For example, this means the temperature on August 15 at a particular location is compared with August 15 temperatures from many prior years at that location. Thus, a marine heat wave can occur at any time of year—even in winter—if the temperature is much warmer than usual. The indicator uses a 30-year historical reference period of 1982–2011 to establish these thresholds.
Each marine heat wave event can be characterized by its duration (length in days) and its intensity (the number of degrees by which the temperature exceeded the 90 percent threshold). Figure 1 combines the duration, intensity, and frequency of marine heat waves into a single metric called cumulative intensity, measured in degree-days. For example, an event lasting 10 days with an intensity of 5 degrees in each day would have a cumulative intensity of 50 degree-days. This indicator adds degree-days for all events to get an annual total. If a location experiences an increase in annual cumulative intensity over time, that means marine heat waves are becoming either more common, longer, more intense, or some combination of the three.
Figure 1 shows the long-term change in annual cumulative intensity at locations within the U.S. exclusive economic zone, which generally extends up to 200 nautical miles from the coast. Figure 2 follows the same approach but presents trends by season, as certain seasons are important times of year for food source availability and life cycle events like spawning and migration. Figure 3 provides a more detailed look at marine heat waves by coastal region, showing the portion of each region’s area affected by marine heat waves in each year, and the strength of each year’s most severe marine heat wave. Figure 4 provides a detailed timeline of marine heat wave events showing the duration, intensity, and level of severity of each event, focusing on five specific locations as case studies. The five locations are designated marine protected areas, which are areas with particular importance for protecting marine species populations. Examples have been selected from each of the different coastal regions.
About the Data
Indicator Notes
Sea surface temperature varies seasonally, but a marine heat wave can happen at any time of year if the water temperature is much higher than normal. Temperatures can also vary as a result of year-to-year climate patterns, such as the El Niño–Southern Oscillation.
The five areas selected for Figure 4 are not meant to be representative of conditions along the entire coastline, but they can be thought of as case studies that more closely illustrate location-specific marine heat wave conditions in ecologically sensitive and protected areas.
Data Sources
This indicator is based on daily sea surface temperature data provided by the National Oceanic and Atmospheric Administration’s National Centers for Environmental Information. These data are available online at: www.ncei.noaa.gov/products/optimum-interpolation-sst.
Technical Documentation
References
1 Cooley, S., Schoeman, D., Bopp, L., Boyd, P., Donner, S., Ghebrehiwet, D. Y., Ito, S.-I., Kiessling, W., Martinetto, P., Ojea, E., Racault, M.-F., Rost, B., & Skern-Mauritzen, M. (2022). Chapter 3: Oceans and coastal ecosystems and their services. In IPCC (Intergovernmental Panel on Climate Change), Climate change 2022—Impacts, adaptation and vulnerability: Working Group II contribution to the Sixth Assessment Report of the Intergovernmental Panel on Climate Change. Cambridge University Press. https://doi.org/10.1017/9781009325844.005
2 Mills, K. E., Osborne, E. B., Bell, R. J., Colgan, C. S., Cooley, S. R., Goldstein, M. C., Griffis, R. B., Holsman, K., Jacox, M., & Micheli, F. (2023). Chapter 10: Ocean ecosystems and marine resources. In USGCRP (U.S. Global Change Research Program), Fifth National Climate Assessment. https://doi.org/10.7930/NCA5.2023.CH10
3 IPCC (Intergovernmental Panel on Climate Change). (2019). Summary for policymakers. In The ocean and cryosphere in a changing climate: Special report of the Intergovernmental Panel on Climate Change. Cambridge University Press. https://doi.org/10.1017/9781009157964.001
4 NOAA (National Oceanic and Atmospheric Administration). (2024). Optimum interpolation SST. Retrieved March 1, 2024, from www.ncei.noaa.gov/products/optimum-interpolation-sst
Learn about other indicators in this section