Climate Change Indicators: Ocean Acidity
This indicator describes changes in the chemistry of the ocean that relate to the amount of carbon dioxide dissolved in the water.
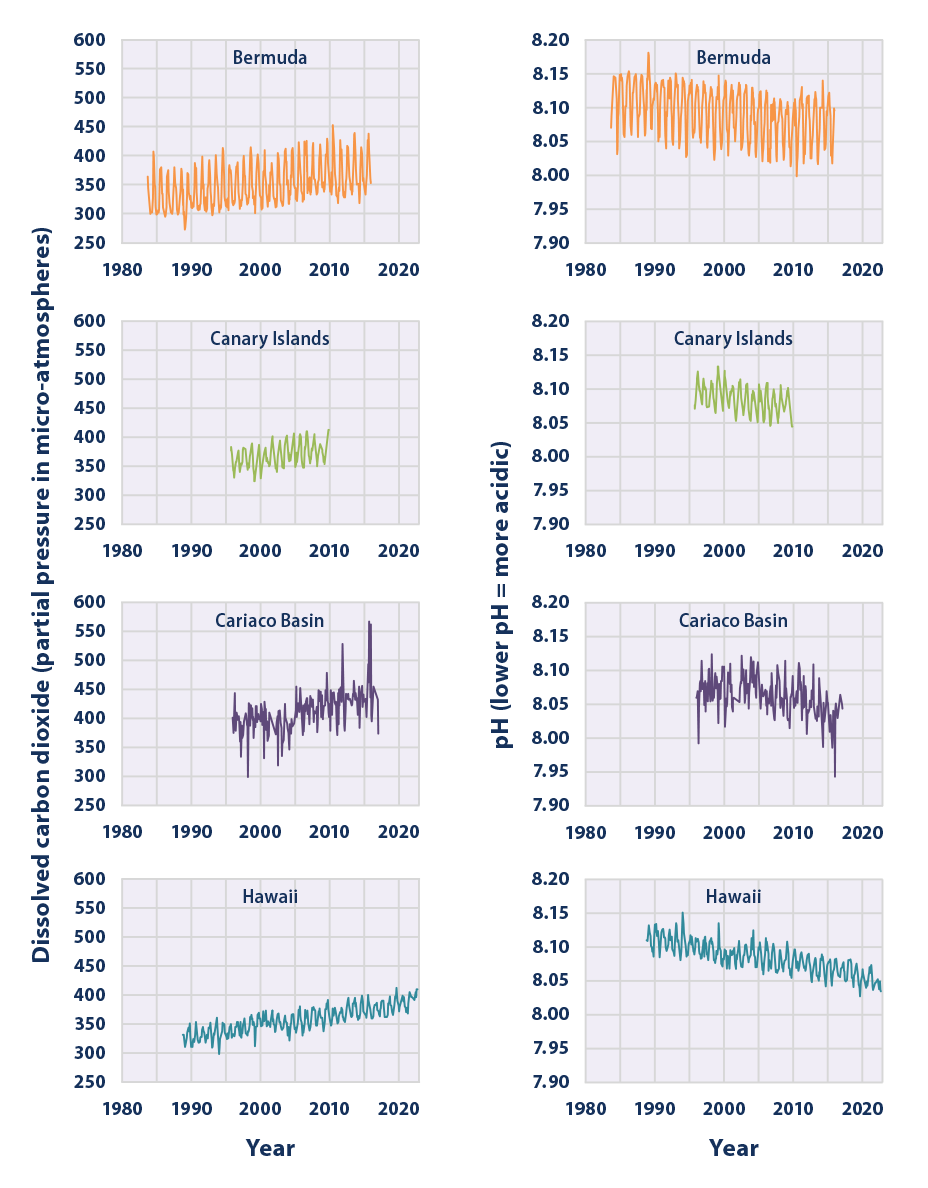
This figure shows the relationship between changes in ocean carbon dioxide levels (measured in the left column as a partial pressure—a common way of measuring the amount of a gas) and acidity (measured as pH in the right column). The data come from two observation stations in the North Atlantic Ocean (Bermuda and Canary Islands), one in the Caribbean Sea (Cariaco), and one in the Pacific (Hawaii). The up-and-down pattern shows the influence of seasonal variations.
Data sources: Bates, 2016;6 González-Dávila, 2012;7 University of South Florida, 2021;8 University of Hawaii, 20239
Web update: June 2024
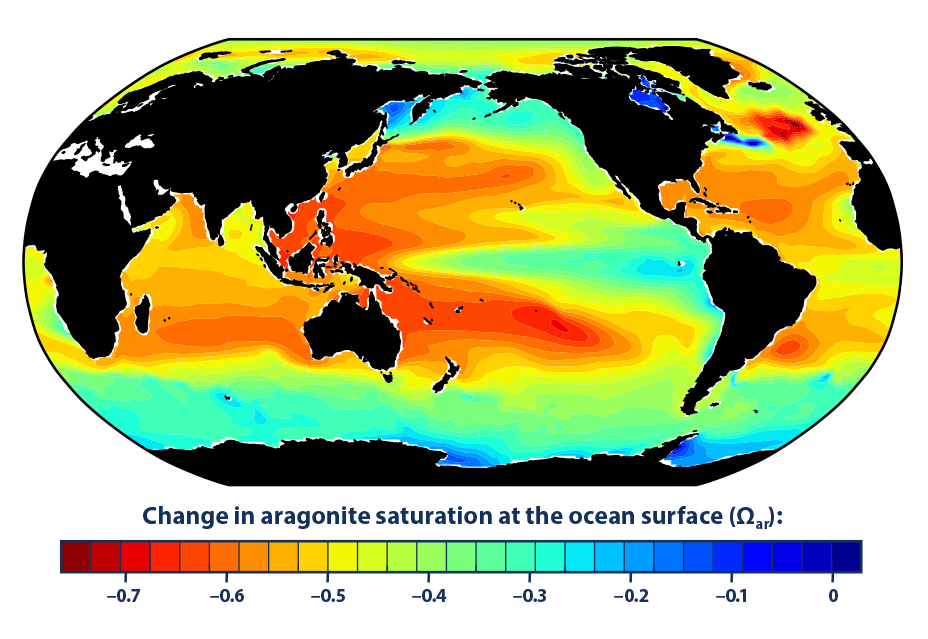
This map shows changes in the aragonite saturation level of ocean surface waters between the 1880s and the most recent decade (2006–2015). Aragonite is a form of calcium carbonate that many marine animals use to build their skeletons and shells. The lower the saturation level, the more difficult it is for organisms to build and maintain their skeletons and shells. A negative change represents a decrease in saturation.
Data source: Woods Hole Oceanographic Institution, 201610
Web update: August 2016

Acidity is commonly measured using the pH scale. Pure water has a pH of about 7, which is considered neutral. A substance with a pH less than 7 is considered to be acidic, while a substance with a pH greater than 7 is considered to be basic or alkaline. The lower the pH, the more acidic the substance. Like the well-known Richter scale for measuring earthquakes, the pH scale is based on powers of 10, which means a substance with a pH of 3 is 10 times more acidic than a substance with a pH of 4. For more information about pH, visit: www.epa.gov/acidrain/what-acid-rain.
Image recreated from: Environment Canada, 2008,4 with additional data from IPCC, 20145
Web update: August 2016
Key Points
- Measurements made over the last few decades have demonstrated that ocean carbon dioxide levels have risen in response to increased carbon dioxide in the atmosphere, leading to an increase in acidity (that is, a decrease in pH) (Figure 1).
- Historical modeling suggests that since the 1880s, increased carbon dioxide has led to lower aragonite saturation levels in the oceans around the world, which makes it more difficult for certain organisms to build and maintain their skeletons and shells (Figure 2).
- The largest decreases in aragonite saturation have occurred in tropical waters (Figure 2); however, decreases in cold areas may be of greater concern because colder waters typically have lower aragonite saturation levels to begin with.3
Background
The ocean plays an important role in regulating the amount of carbon dioxide in the atmosphere. As atmospheric concentrations of carbon dioxide rise (see the Atmospheric Concentrations of Greenhouse Gases indicator), the ocean absorbs more carbon dioxide. Because of the slow mixing time between surface waters and deeper waters, it can take hundreds to thousands of years to establish this balance. From 1750 to 2019, oceans absorbed about 25 percent of the carbon dioxide emitted into the atmosphere by human activities, according to data in the IPCC Sixth Assessment Report (total human emissions of 685 ± 75 PgC and ocean uptake of 170 ± 20 PgC).1
Although the ocean’s ability to take up carbon dioxide prevents atmospheric levels from climbing even higher, rising levels of carbon dioxide dissolved in the ocean can have a negative effect on some marine life. Carbon dioxide reacts with sea water to produce carbonic acid. The resulting increase in acidity (measured by lower pH values) changes the balance of minerals in the water. This makes it more difficult for corals, some types of plankton, and other creatures to produce a mineral called calcium carbonate, which is the main ingredient in their hard skeletons or shells. Thus, declining pH can make it more difficult for these animals to thrive. This can lead to broader changes in the overall structure of ocean and coastal ecosystems, and can ultimately affect fish and shellfish populations and the people, communities, or Tribes who depend on them for jobs or subsistence.2
While changes in ocean pH and mineral saturation caused by the uptake of atmospheric carbon dioxide generally occur over many decades, these properties can fluctuate over shorter periods, especially in coastal and surface waters. For example, increased photosynthesis during the day and during the summer leads to natural fluctuations in pH. Acidity also varies with water temperature.
About the Indicator
This indicator describes trends in pH and related properties of ocean water, based on a combination of direct observations, calculations, and modeling.
Figure 1 shows pH values and levels of dissolved carbon dioxide at four locations that have collected measurements consistently over the last few decades. These data have been either measured directly or calculated from related measurements, such as dissolved inorganic carbon and alkalinity. Data come from two stations in the Atlantic Ocean (Bermuda and the Canary Islands), one in the Caribbean Sea (Cariaco Basin), and one in the Pacific (Hawaii).
The global map in Figure 2 shows changes over time in aragonite saturation level. Aragonite is a specific form of calcium carbonate that many organisms produce and use to build their skeletons and shells, and the saturation state is a measure of how easily aragonite can dissolve in the water. The lower the saturation level, the more difficult it is for organisms to build and maintain their protective skeletons and shells. This map was created by comparing average conditions during the 1880s with average conditions during the most recent 10 years of available data (2006–2015). Aragonite saturation has only been measured at selected locations during the last few decades, but it can be calculated reliably for different times and locations based on the relationships scientists have observed among aragonite saturation, pH, dissolved carbon, water temperature, concentrations of carbon dioxide in the atmosphere, and other factors that can be measured. Thus, while Figure 2 was created using a computer model, it is based on measurements.
About the Data
Indicator Notes
This indicator focuses on surface waters, which can absorb carbon dioxide from the atmosphere within a few months.3 It can take much longer for changes in pH and mineral saturation to spread to deeper waters, so the full effect of increased atmospheric carbon dioxide concentrations on ocean acidity may not be seen for many decades, if not centuries. Studies suggest that the impacts of ocean acidification may be greater at depth, because the aragonite saturation level is naturally lower in deeper waters.3
Ocean chemistry is not uniform around the world, so local conditions can cause pH or aragonite saturation measurements to differ from the global average. For example, carbon dioxide dissolves more readily in cold water than in warm water, so colder regions could experience greater impacts from acidity than warmer regions. Air and water pollution also lead to increased acidity in some areas.
Data Sources
Data for Figure 1 came from four studies: the Bermuda Atlantic Time-Series Study, the European Station for Time-Series in the Ocean (Canary Islands), the Carbon Retention in a Colored Ocean (CARIACO) program (Cariaco Basin), and the Hawaii Ocean Time-Series. Bermuda data are available at: https://bats.bios.asu.edu. Canary Islands data are available at: https://plocan.eu/en/installations/ocean-observatory, and Cariaco Basin data are available at: https://erddap.bco-dmo.org/erddap/tabledap/bcodmo_dataset_3093.htmlTable. Hawaii data are available at: https://hahana.soest.hawaii.edu/hot/hotco2/HOT_surface_CO2.txt.
The map in Figure 2 was created by the National Oceanic and Atmospheric Administration and the Woods Hole Oceanographic Institution using Community Earth System Model data. Related information can be found at: www.cesm.ucar.edu/models.
Technical Documentation
References
1 Canadell, J. G., Monteiro, P. M. S., Costa, M. H., Cotrim da Cunha, L., Cox, P. M., Eliseev, A. V., Henson, S., Ishii, M., Jaccard, S., Koven, C., Lohila, A., Patra, P. K., Piao, S., Rogelj, J., Syampungani, S., Zaehle, S., & Zickfeld, K. (2021). Chapter 5: Global carbon and other biogeochemical cycles and feedbacks. In IPCC (Intergovernmental Panel on Climate Change), Climate change 2021—The physical science basis: Working Group I contribution to the Sixth Assessment Report of the Intergovernmental Panel on Climate Change. Cambridge University Press. https://doi.org/10.1017/9781009157896.007
2 Bednaršek, N., Tarling, G. A., Bakker, D. C. E., Fielding, S., Jones, E. M., Venables, H. J., Ward, P., Kuzirian, A., Lézé, B., Feely, R. A., & Murphy, E. J. (2012). Extensive dissolution of live pteropods in the Southern Ocean. Nature Geoscience, 5(12), 881–885. https://doi.org/10.1038/ngeo1635
3 Feely, R., Doney, S., & Cooley, S. (2009). Ocean acidification: Present conditions and future changes in a high-CO2 world. Oceanography, 22(4), 36–47. https://doi.org/10.5670/oceanog.2009.95
4 Environment Canada. (2008). Acid rain. Retrieved April 16, 2024, from https://web.archive.org/web/20130312025534/http://www.ec.gc.ca/eau-water/default.asp?lang=En&n=FDF30C16-1
5 IPCC (Intergovernmental Panel on Climate Change). (2014). Climate change 2014—Impacts, adaptation, and vulnerability: Working Group II contribution to the IPCC Fifth Assessment Report of the Intergovernmental Panel on Climate Change (R. K. Pachauri & L. A. Meyer, Eds.). Cambridge University Press. www.ipcc.ch/report/ar5/syr
6 Bates, N. R. (2016). Update to data originally published in Bates, N. R., Best, M. H. P., Neely, K., Garley, R., Dickson, A. G., & Johnson, R. J. (2012). Detecting anthropogenic carbon dioxide uptake and ocean acidification in the North Atlantic Ocean. Biogeosciences, 9(7), 2509–2522. https://doi.org/10.5194/bg-9-2509-2012
7 González-Dávila, M. (2012). Update to data originally published in González-Dávila, M., Santana-Casiano, J. M., Rueda, M. J., & Llinás, O. (2010). The water column distribution of carbonate system variables at the ESTOC site from 1995 to 2004. Biogeosciences, 7(10), 3067–3081. https://doi.org/10.5194/bg-7-3067-2010
8 University of South Florida. (2021). Carbon Retention in a Colored Ocean (CARIACO) Ocean Time-Series Program [Data set]. Retrieved March 1, 2021, from https://erddap.bco-dmo.org/erddap/tabledap/bcodmo_dataset_3093.htmlTable
9 University of Hawai'i. (2023). Hawaii Ocean Time-Series (HOT) [Data set]. Retrieved March 12, 2024, from https://hahana.soest.hawaii.edu/hot/hotco2/HOT_surface_CO2.txt
10 Woods Hole Oceanographic Institution. (2016). Update to data originally published in Feely, R., Doney, S., & Cooley, S. (2009). Ocean acidification: Present conditions and future changes in a high-CO2 world. Oceanography, 22(4), 36–47. https://doi.org/10.5670/oceanog.2009.95
Learn about other indicators in this section