Climate Change Indicators: Snowpack
This indicator measures trends in the amount and timing of snowpack in the western United States.
Figure 1. Trends in April Snowpack in the Western United States, 1955–2023
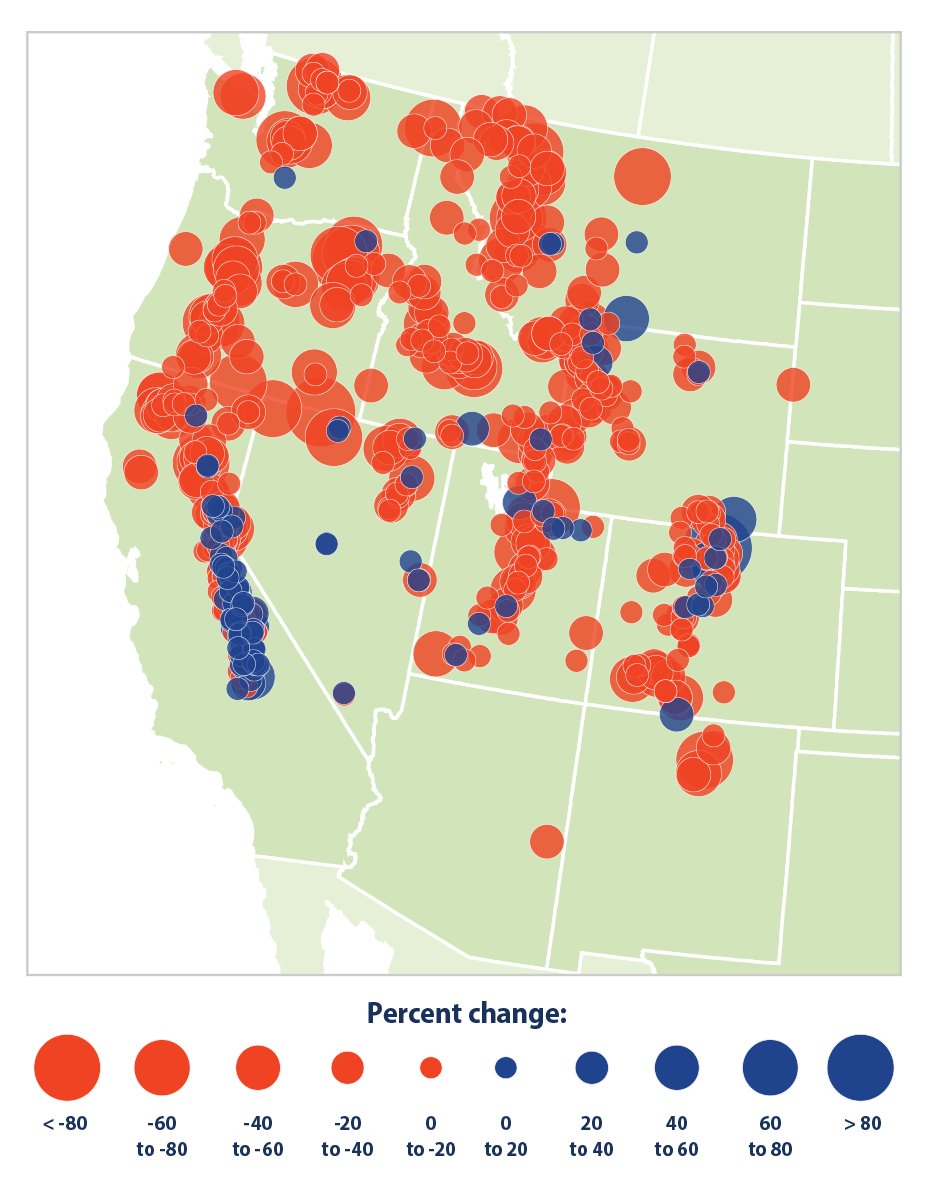
This map shows trends in April snowpack in the western United States, measured in terms of snow water equivalent. Blue circles represent increased snowpack; red circles represent a decrease.
Data source: USDA Natural Resources Conservation Service, 20245
Web update: June 2024
Figure 2. Change in Peak Snowpack Timing in the Western United States, 1982–2023
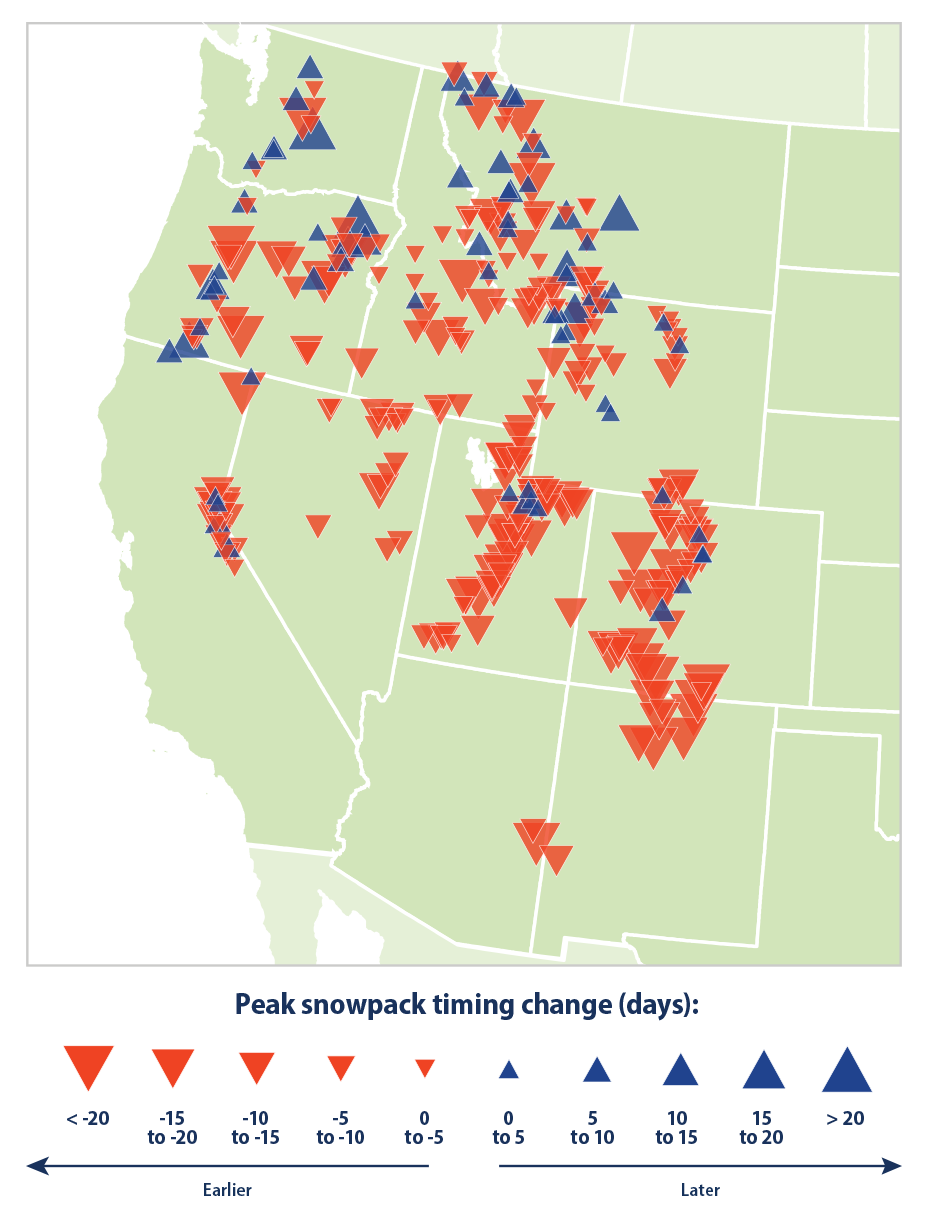
This map shows trends in the date during the year when snowpack reaches its maximum amount across the western United States. Blue triangles represent a shift to later timing; red triangles represent a shift to earlier timing.
Data source: USDA Natural Resources Conservation Service, 20236
Web update: June 2024
Figure 3. Average Date of Peak Snowpack in the Western United States, 1982–2023
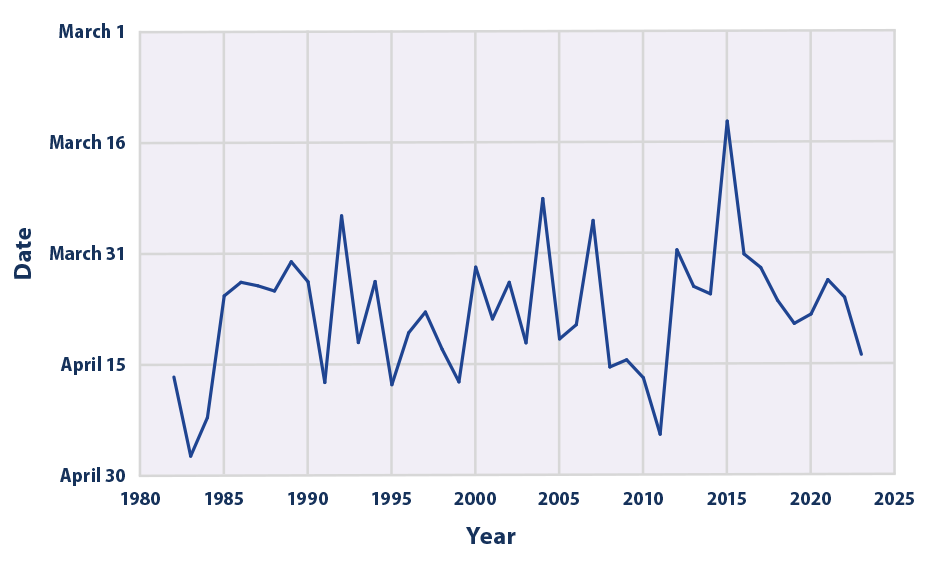
This graph shows trends in the date during the year when snowpack reaches its maximum amount across the western United States. The line in this graph represents an average of all the sites shown in Figure 2.
Data source: USDA Natural Resources Conservation Service, 20236
Web update: June 2024
Figure 4. Change in Snowpack Season Length in the Western United States, 1982–2023
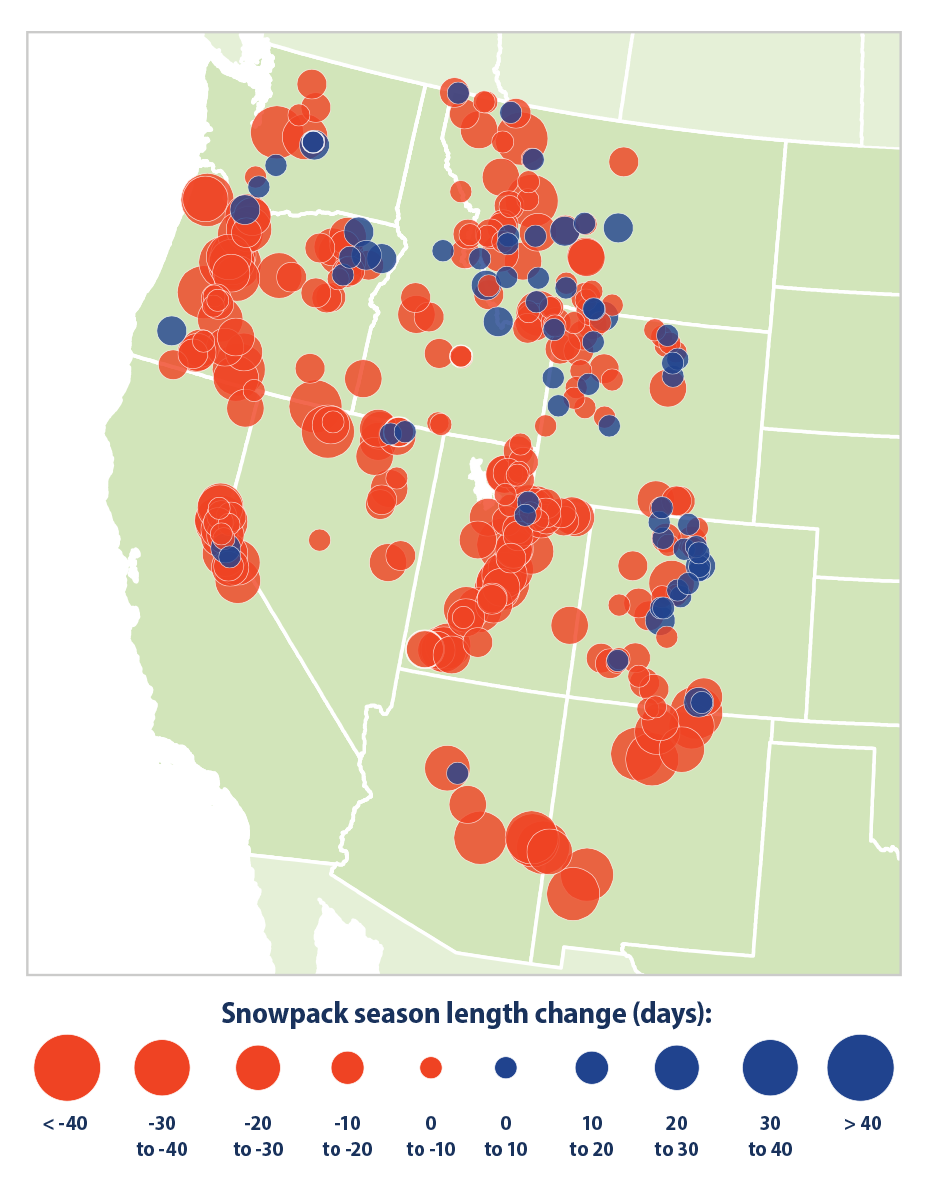
This map shows trends in the length of the snowpack season across the western United States, in days. Blue circles show where the season has grown longer; red circles show where it has become shorter.
Data source: USDA Natural Resources Conservation Service, 20236
Web update: June 2024
Key Points
- From 1955 to 2023, April snowpack declined at 81 percent of the sites measured (see Figure 1). The average change across all sites amounts to about an 18 percent decline.
- Large and consistent decreases in April snowpack have been observed throughout the western United States (see Figure 1). Decreases have been especially prominent in Washington, Oregon, northern California, and the northern Rockies.
- While some stations have experienced increases in April snowpack, all 12 states included in this indicator experienced a decrease in snowpack on average from 1955 to 2023 (see Figure 1). In the Northwest (Idaho, Oregon, Washington), all but four stations saw decreases in snowpack over the period of record.
- Almost 80 percent of sites have experienced a shift toward earlier peak snowpack (see Figure 2). This earlier trend is especially pronounced in southwestern states like Colorado, New Mexico, and Utah. Across all stations, peak snowpack has shifted earlier by an average of nearly seven days since 1982 (see Figure 3), based on the long-term average rate of change.
- From 1982 to 2023, the snowpack season became shorter at about 80 percent of the sites where snowpack was measured (see Figure 4). Across all sites, the length of the snowpack season decreased by about 15 days, on average.
Background
Temperature and precipitation are key factors affecting snowpack, which is the amount or thickness of snow that accumulates on the ground. In a warming climate, more precipitation will be expected to fall as rain rather than snow in most areas—reducing the extent and depth of snowpack. Long-term observations across the contiguous 48 states show that nearly 80 percent of weather stations examined have experienced a decrease in the proportion of precipitation falling as snow (see the Snowfall indicator). In addition, with warmer winters and springs (see the Seasonal Temperature indicator), the seasonality of snowpack is also changing. Higher temperatures cause snow to melt earlier, which in turn affects the timing and availability of water.
Mountain snowpack plays a key role in the water cycle in western North America, storing water in the winter when the snow falls and releasing it as runoff in spring and summer when the snow melts. Millions of people in the West depend on the melting of mountain snowpack for hydropower, irrigation, and drinking water. In most western river basins, snowpack is a larger component of water storage than human-constructed reservoirs.1 Continued reductions in snowpack and shifts in snowmelt are expected in the future, which will reduce hydropower production in the West.2
Changes in mountain snowpack can affect agriculture, winter recreation, and tourism in some areas, as well as plants and wildlife. For example, certain types of trees rely on snow for insulation from freezing temperatures, as do some animal species. In addition, fish spawning could be disrupted if changes in snowpack or snowmelt alter the timing and abundance of streamflows. (For a look at long-term trends in the timing of spring snowmelt runoff in United States, see the Streamflow indicator.) Additionally, warming and earlier snowmelt accelerate the start of the wildfire season and promote more wildfire activity in the western United States and Alaska (see the Wildfires indicator).3,4 Altogether, snowpack’s sensitivity to climate and its many related effects make this a valuable indicator to track.
About the Indicator
This indicator uses a measurement called snow water equivalent to determine trends in snowpack. Snow water equivalent is the amount of water contained within the snowpack at a particular location. It can be thought of as the depth of water that would result if the entire snowpack were to melt. Figure 1 shows long-term rates of change for April 1, the most frequent observation date, because it could reflect changes in precipitation, and it is extensively used for spring streamflow and water supply forecasting. Figures 2 and 3 focus on the day of each year when snowpack is at its deepest (that is, peak snowpack) to determine if it is occurring earlier or later. Figure 4 shows changes in the length of the snowpack season, representing the number of days when the ground is covered by continuous snowpack.
The U.S. Department of Agriculture and other collaborators have measured snowpack since the early 1900s. In the early years of data collection, researchers measured snow water equivalent manually, but since 1980, measurements at some locations have been collected with automated instruments as part of the snow telemetry (SNOTEL) network. The long-term analysis in Figure 1 is based on data from nearly 700 permanent measurement sites in the western United States. The snowpack analysis shown in Figures 2, 3 and 4 requires daily measurements, so it uses a smaller set of 340 SNOTEL sites that have data since 1982, which is when a large number of SNOTEL devices were deployed and came online.
About the Data
Indicator Notes
EPA selected 1955 as a starting point for Figure 1 because many measurement sites in the Southwest were established in the early 1950s. Natural variability in the Earth’s climate means that snowpack trends may vary slightly when measured over different time periods. For example, the period from 1945 to 1955 was unusually snowy in the Northwest, so if this indicator were to start in 1945 or 1950, the Northwest would appear to show larger decreases over time. However, the general direction of the trend is the same regardless of the start date. Analysis of the peak snowpack in Figures 2, 3, and 4 is limited to automated SNOTEL stations, which results in a shorter time period and a smaller number of stations than Figure 1. These analyses are less subject to year-to-year variation than a time series based on a single date like April 1, but snowpack conditions during the first few years (in this case, the early to mid-1980s) could still have a sizable influence on the trends calculated for this indicator.
Although most parts of the West have seen reductions in snowpack―consistent with overall warming trends shown in the U.S. and Global Temperature indicator―snowfall trends may be partially influenced by non-climatic factors such as observation methods, land-use changes, and forest canopy changes. This indicator applies consistent methods to all locations, but each site naturally has unique local conditions and a unique distribution of data. For many of the areas where snowpack is increasing, studies have documented that despite general increases in temperature and precipitation, temperatures often remain below the freezing point, resulting in more snowfall.7,8
Data Sources
Data for this indicator came from the U.S. Department of Agriculture’s Natural Resources Conservation Service Water and Climate Center. The April 1 trend analysis for this indicator was constructed using methods consistent with Mote et al. (2005) and Mote et al. (2018),1,9 the peak snowpack analysis was adapted from work by Evan (2019),10 and snowpack season length was calculated using methods from Petersky and Harpold (2018).11 The U.S. Department of Agriculture data are available at: www.wcc.nrcs.usda.gov.
Technical Documentation
References
1 Mote, P. W., Hamlet, A. F., Clark, M. P., & Lettenmaier, D. P. (2005). Declining mountain snowpack in western North America. Bulletin of the American Meteorological Society, 86(1), 39–50. https://doi.org/10.1175/BAMS-86-1-39
2 Payton, E. A., Pinson, A. O., Asefa, T., Condon, L. E., Dupigny-Giroux, L.-A. L., Harding, B. L., Kiang, J., Lee, D. H., McAfee, S. A., Pflug, J., Rangwala, I., Tanana, H. J., & Wright, D. B. (2023). Chapter 4: Water. In USGCRP (U.S. Global Change Research Program), Fifth National Climate Assessment. https://doi.org/10.7930/NCA5.2023.CH4
3 Westerling, A. L. (2016). Increasing western US forest wildfire activity: Sensitivity to changes in the timing of spring. Philosophical Transactions of the Royal Society B: Biological Sciences, 371(1696), 20150178. https://doi.org/10.1098/rstb.2015.0178
4 Kitzberger, T., Falk, D. A., Westerling, A. L., & Swetnam, T. W. (2017). Direct and indirect climate controls predict heterogeneous early-mid 21st century wildfire burned area across western and boreal North America. PLOS ONE, 12(12), e0188486. https://doi.org/10.1371/journal.pone.0188486
5 USDA (U.S. Department of Agriculture) Natural Resources Conservation Service. (2024). Snow telemetry (SNOTEL) and snow course data and products. Retrieved January 2, 2024, from www.drought.gov/data-maps-tools/nrcs-snotel-and-snow-course-data
6 USDA (U.S. Department of Agriculture) Natural Resources Conservation Service. (2023). Snow telemetry (SNOTEL) and snow course data and products. Retrieved October 1, 2023, from www.drought.gov/data-maps-tools/nrcs-snotel-and-snow-course-data
7 Luce, C. H., Lopez-Burgos, V., & Holden, Z. (2014). Sensitivity of snowpack storage to precipitation and temperature using spatial and temporal analog models. Water Resources Research, 50(12), 9447–9462. https://doi.org/10.1002/2013WR014844
8 Scalzitti, J., Strong, C., & Kochanski, A. (2016). Climate change impact on the roles of temperature and precipitation in western U.S. snowpack variability. Geophysical Research Letters, 43(10), 5361–5369. https://doi.org/10.1002/2016GL068798
9 Mote, P. W., Li, S., Lettenmaier, D. P., Xiao, M., & Engel, R. (2018). Dramatic declines in snowpack in the western US. Climate and Atmospheric Science, 1, 2. https://doi.org/10.1038/s41612-018-0012-1
10 Evan, A. T. (2019). A new method to characterize changes in the seasonal cycle of snowpack. Journal of Applied Meteorology and Climatology, 58(1), 131–143. https://doi.org/10.1175/JAMC-D-18-0150.1
11 Petersky, R., & Harpold, A. (2018). Now you see it, now you don’t: A case study of ephemeral snowpacks and soil moisture response in the Great Basin, USA. Hydrology and Earth System Sciences, 22(9), 4891–4906. https://doi.org/10.5194/hess-22-4891-2018
Learn about other indicators in this section