Climate Change Indicators: Drought
This indicator measures drought conditions of U.S. lands.
Figure 1. Average Drought Conditions in the Contiguous 48 States According to the Palmer Index, 1895–2023
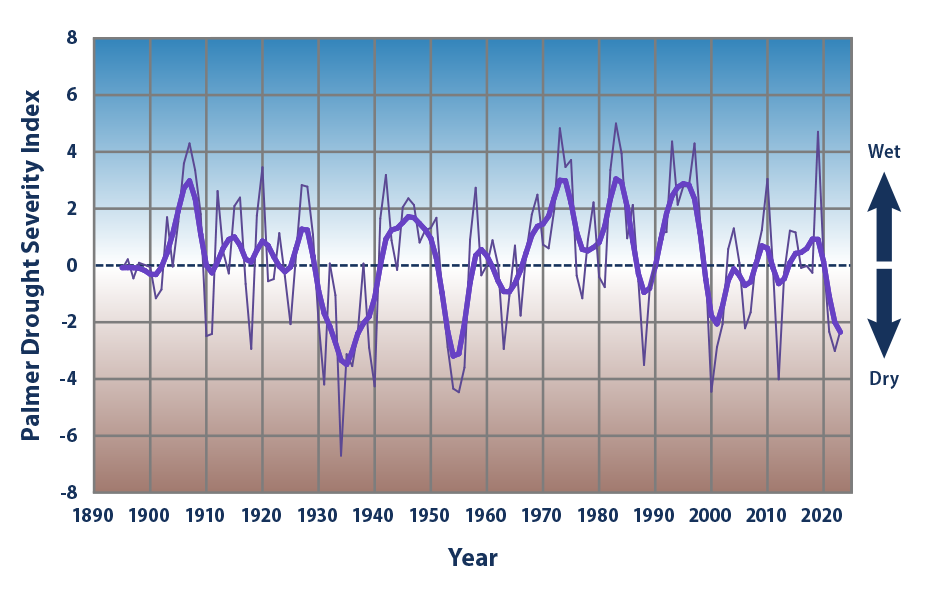
This chart shows annual values of the Palmer Drought Severity Index, averaged over the entire area of the contiguous 48 states. Positive values represent wetter-than-average conditions, while negative values represent drier-than-average conditions. A value between -2 and -3 indicates moderate drought, -3 to -4 is severe drought, and -4 or below indicates extreme drought. The thicker line is a nine-year weighted average.
Data source: NOAA, 20247
Web update: June 2024
Figure 2. Average Drought Conditions Across the Contiguous 48 States According to the SPEI, 1900–2023
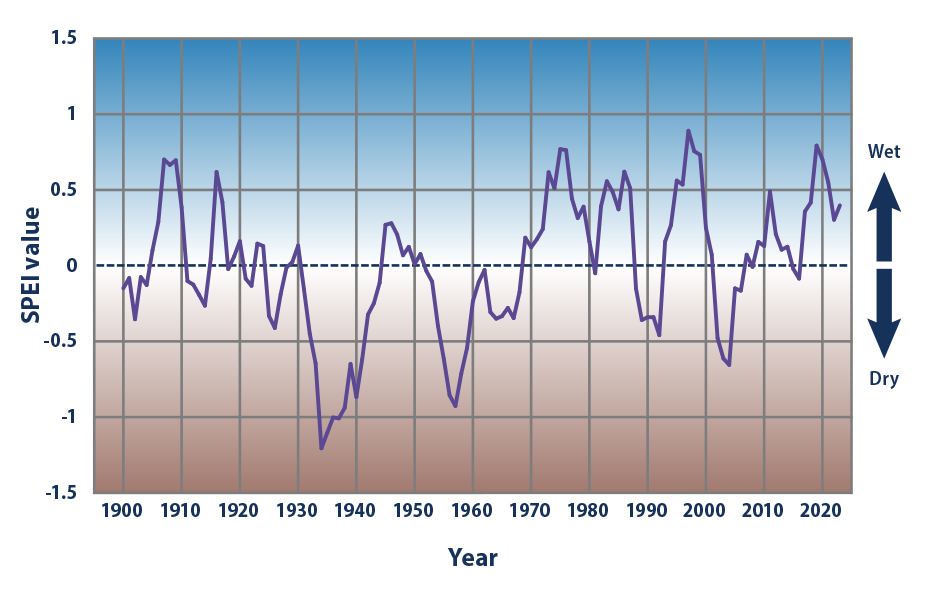
This graph shows annual values of the SPEI, averaged over the entire area of the contiguous 48 states. The line in this graph represents an average SPEI value for each year, based on conditions over the preceding five years (five-year SPEI). Positive values represent wetter-than-average conditions, while negative values represent drier-than-average conditions.
Data sources: Abatzoglou et al., 2017;5 Western Regional Climate Center, 20248
Web update: June 2024
Figure 3. Average Change in Drought (Five-Year SPEI) in the Contiguous 48 States, 1900–2023
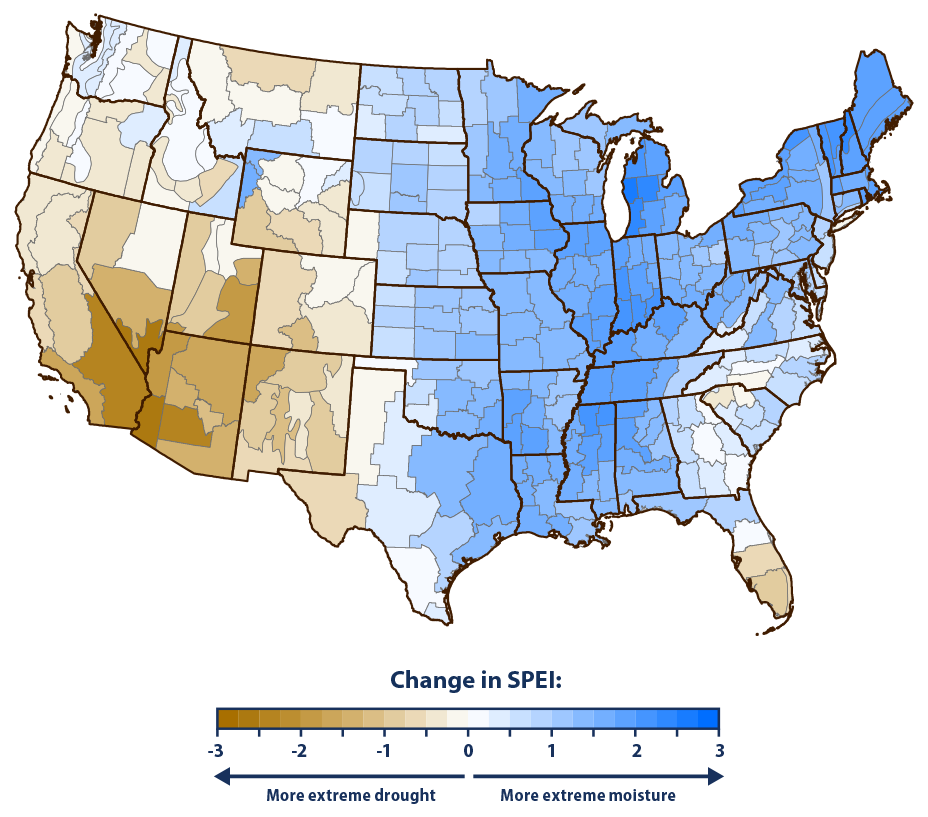
This map shows the total change in drought conditions across the contiguous 48 states, based on the long-term average rate of change in the five-year SPEI from 1900 to 2023. Data are displayed for small regions called climate divisions. Blue areas represent increased moisture; brown areas represent decreased moisture or drier conditions.
Data sources: Abatzoglou et al., 2017;5 Western Regional Climate Center, 20248
Web update: June 2024
Figure 4. U.S. Lands Under Drought Conditions, 2000–2023
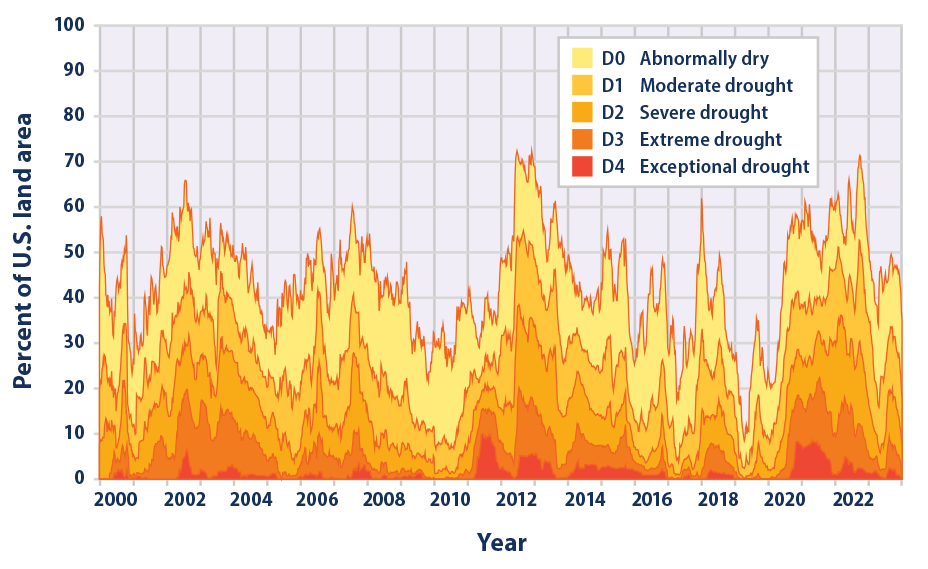
This chart shows the percentage of U.S. lands classified under drought conditions from 2000 through 2023. This figure uses the U.S. Drought Monitor classification system, which is described in the following table. The data cover all 50 states plus Puerto Rico.
Data source: National Drought Mitigation Center, 20249
Web update: June 2024
| Category | Description | Possible Impacts |
|---|---|---|
| D0 | Abnormally dry | Going into drought: short-term dryness slowing planting or growth of crops or pastures. Coming out of drought: some lingering water deficits; pastures or crops not fully recovered. |
| D1 | Moderate drought | Some damage to crops or pastures; streams, reservoirs, or wells low; some water shortages developing or imminent; voluntary water use restrictions requested. |
| D2 | Severe drought | Crop or pasture losses likely; water shortages common; water restrictions imposed. |
| D3 | Extreme drought | Major crop/pasture losses; widespread water shortages or restrictions. |
| D4 | Exceptional drought | Exceptional and widespread crop/pasture losses; shortages of water in reservoirs, streams, and wells, creating water emergencies. |
Key Points
- Average drought conditions across the nation have varied over time. The 1930s and 1950s saw the most widespread droughts, while the last 50 years have generally been wetter than average (see Figures 1 and 2). Over the entire period shown in Figures 1 and 2, the overall trend has been toward wetter conditions, with the SPEI increasing at a rate of about 0.03 units per decade (see Figure 2).
- Large and consistent decreases in the SPEI have been observed throughout the western United States. Decreases have been especially prominent in southwestern states such as California, Arizona, and New Mexico. The eastern United States—in particular the Midwest and Northeast—has experienced generally wetter conditions (see Figure 3).
- In terms of scale and duration, the droughts of the 1930s Dust Bowl era remain the most extreme in the historical record (see Figures 1 and 2).
- Over the period from 2000 through 2023, roughly 10 to 70 percent of the U.S. land area experienced conditions that were at least abnormally dry at any given time (see Figure 4). The years 2002–2003 and 2012–2013 had a relatively large area with at least abnormally dry conditions, while 2009–2011, 2016–2017, and 2019 had substantially less area experiencing drought.
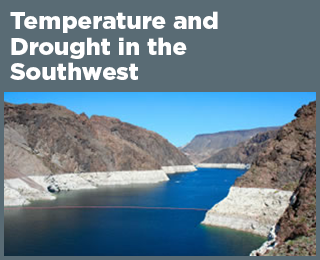
- During the latter half of 2012, more than half of the U.S. land area was covered by moderate or greater drought (see Figure 4). In several states, 2012 was among the driest years on record.6 See Temperature and Drought in the Southwest for a closer look at recent drought conditions in one of the hardest-hit regions.
Background
There are many definitions and types of drought. Meteorologists generally define drought as a prolonged period of dry weather caused by a lack of precipitation that results in a serious water shortage for some activity, population, or ecological system. Drought can also be thought of as an extended imbalance between precipitation and evaporation.
As average temperatures have risen because of climate change, the Earth’s water cycle has sped up through an increase in the rate of evaporation from the Earth’s surface (including soil, lakes, and reservoirs) and transpiration from plants. An increase in evapotranspiration makes more water available in the air for precipitation, but contributes to drying over some land areas, leaving less moisture in the soil. As the climate continues to change, many historically wet areas are likely to experience increased precipitation (see the U.S. and Global Precipitation indicator) and increased risk of flooding (see the Heavy Precipitation indicator), while historically dry areas are likely to experience less precipitation and increased risk of drought.1 As a result, since the 1950s, some regions of the world have experienced an increase in some types of drought, including western North America, southern Europe, and much of Africa.2
Drought conditions can negatively affect agriculture, water supplies, energy production, human health, and many other aspects of society. The impacts vary depending on the type, location, intensity, and duration of the drought. For example, effects on agriculture can range from slowed plant growth to severe crop losses, while water supply impacts can range from lowered reservoir levels and dried-up streams to major water shortages. Prolonged droughts pose a particular threat to indigenous populations because of their economic and cultural dependence on land and water supplies. Warming and drought can threaten medicinal and culturally important plants and animals and can reduce water quality and availability, making tribal populations particularly vulnerable to waterborne illnesses.3 Lower streamflow and groundwater levels can also harm ecosystems more broadly, by harming plants and animals and increasing the risk of wildfires (see the Wildfires indicator).
About the Indicator
During the 20th century, many indices were created to measure drought severity by looking at precipitation, soil moisture, stream flow, vegetation health, and other variables.4 Figure 1 shows annual values of the most widely used index, the Palmer Drought Severity Index, which is calculated from precipitation and temperature measurements at weather stations. An index value of zero represents the average moisture conditions observed between 1931 and 1990 at a given location. A positive value means conditions are wetter than average, while a negative value is drier than average. Index values from locations across the contiguous 48 states have been averaged together to produce the national values shown in Figure 1.
Figures 2 and 3 show the Standardized Precipitation Evapotranspiration Index (SPEI), which measures the combination of water supply (precipitation) and atmospheric water demand (evapotranspiration, which is based on temperature) to determine whether a certain area is experiencing extreme drought, extreme moisture, or conditions in between. This combination of inputs is useful because it allows the SPEI to consider how droughts might affect agriculture and ecosystems, which depend on a balance between water supply and demand. SPEI values between -1 and 1 are considered near normal for a given area, whereas values below -1 signify drought and values above 1 signify unusually moist conditions. Because drought conditions fluctuate naturally, it is helpful to look at average conditions over several years to explore how drought is connected to long-term climate change.5 For this reason, this indicator presents average SPEI values over consecutive five-year periods. For example, the 2023 SPEI score for a particular area is actually the average of 60 months of SPEI data, from July 2018 through June 2023.
For a more detailed perspective on recent trends, Figure 4 shows an index called the Drought Monitor, which is based on several indices (including Palmer), along with additional factors such as snow water content, groundwater levels, reservoir storage, pasture/range conditions, and other impacts. The Drought Monitor uses codes from D0 to D4 (see table after Figure 4) to classify drought severity. This part of the indicator covers all 50 states and Puerto Rico.
About the Data
Indicator Notes
Natural variability in the Earth’s climate means that drought trends may vary slightly when measured over different time periods. Using a multi-year index as shown in Figures 2 and 3 (five-year SPEI) is relevant for examining climate trends and potential connections to climate change.5 Periods with extreme drought conditions (e.g., 1930s) can influence the long-term trends calculated for this indicator.
The SPEI values used for this indicator are based on weighted PRISM data by location.10 The underlying method for calculating SPEI does not account for variables such as solar radiation, humidity, and wind speed that can all influence drought conditions. As a result, the SPEI shown here is more reflective of the influence of temperature. This is a limitation and potential source of uncertainty in interpreting drought conditions.
The U.S. Drought Monitor (Figure 4) offers a closer look at the percentage of the country that is affected by drought. The period of record for this index is relatively short, however, and thus too short-lived to be used for assessing long-term climate trends or exploring how recent observations compare with historical patterns. With several decades of data collection, future versions of this indicator should be able to paint a more complete picture of trends over time.
Overall, this indicator gives a broad overview of drought conditions in the United States. It is not intended to replace local information that might describe conditions more precisely for a particular region. The national averages in Figures 1 and 2 are particularly limited in this regard, as averaging drought metrics over such a large area can obscure drought extremes occurring at regional scales. Thus, these national graphs might understate the degree to which droughts are becoming more severe in some areas while other places receive more rain as a result of climate change.
Data Sources
Data for Figure 1 were obtained from the National Oceanic and Atmospheric Administration’s National Centers for Environmental Information, which maintains a large collection of climate data online at: www.ncei.noaa.gov/access/monitoring/climate-at-a-glance.
Data for Figures 2 and 3 came from the WestWide Drought Tracker, which is a collaboration between the University of Idaho, the Western Regional Climate Center, and the Desert Research Institute. These data are available at: https://wrcc.dri.edu/wwdt/batchdownload.php. The measured index values are derived from Oregon State University’s PRISM Climate Mapping Program. Figures 2 and 3 were constructed using methods described by Vicente-Serrano et al. (2010).11
Data for Figure 4 were provided by the National Drought Mitigation Center. Historical data in table form are available at: https://droughtmonitor.unl.edu/DmData/DataTables.aspx.
Technical Documentation
References
1 Marvel, K., Su, W., Delgado, R., Aarons, S., Chatterjee, A., Garcia, M. E., Hausfather, Z., Hayhoe, K., Hence, D. A., Jewett, E. B., Robel, A., Singh, D., Tripati, A., & Vose, R. S. (2023). Chapter 2: Climate trends. In USGCRP (U.S. Global Change Research Program), Fifth National Climate Assessment. https://doi.org/10.7930/NCA5.2023.CH2
2 IPCC (Intergovernmental Panel on Climate Change). (2021). Climate change 2021—The physical science basis: Working Group I contribution to the Sixth Assessment Report of the Intergovernmental Panel on Climate Change (V. Masson-Delmotte, P. Zhai, A. Pirani, S. L. Connors, C. Péan, S. Berger, N. Caud, Y. Chen, L. Goldfarb, M. I. Gomis, M. Huang, K. Leitzell, E. Lonnoy, J. B. R. Matthews, T. K. Maycock, T. Waterfield, O. Yelekçi, R. Yu, & B. Zhou, Eds.). Cambridge University Press. https://doi.org/10.1017/9781009157896
3 Gamble, J. L., Balbus, J., Berger, M., Bouye, K., Campbell, V., Chief, K., Conlon, K., Crimmins, A., Flanagan, B., Gonzalez-Maddux, C., Hallisey, E., Hutchins, S., Jantarasami, L., Khoury, S., Kiefer, M., Kolling, J., Lynn, K., Manangan, A., McDonald, M., … Wolkin, A. F. (2016). Chapter 9: Populations of concern. In USGCRP (U.S. Global Change Research Program), The impacts of climate change on human health in the United States: A scientific assessment (pp. 247–286). https://doi.org/10.7930/J0Q81B0T
4 Heim, R. R. (2002). A review of twentieth-century drought indices used in the United States. Bulletin of the American Meteorological Society, 83(8), 1149–1166. https://doi.org/10.1175/1520-0477-83.8.1149
5 Abatzoglou, J. T., McEvoy, D. J., & Redmond, K. T. (2017). The West Wide Drought Tracker: Drought monitoring at fine spatial scales. Bulletin of the American Meteorological Society, 98(9), 1815–1820. https://doi.org/10.1175/BAMS-D-16-0193.1
6 NOAA (National Oceanic and Atmospheric Administration) National Centers for Environmental Information. (2013). Monthly national climate report for December 2012. www.ncei.noaa.gov/access/monitoring/monthly-report/national/201212
7 NOAA (National Oceanic and Atmospheric Administration) National Centers for Environmental Information. (2024). Climate at a glance [Data set]. Retrieved February 1, 2024, from www.ncei.noaa.gov/access/monitoring/climate-at-a-glance
8 Western Regional Climate Center. (2024). WestWide Drought Tracker. Retrieved January 1, 2024, from https://wrcc.dri.edu/wwdt
9 National Drought Mitigation Center. (2024). U.S. drought monitor. Retrieved February 1, 2024, from https://droughtmonitor.unl.edu
10 Daly, C., Halbleib, M., Smith, J. I., Gibson, W. P., Doggett, M. K., Taylor, G. H., Curtis, J., & Pasteris, P. P. (2008). Physiographically sensitive mapping of climatological temperature and precipitation across the conterminous United States. International Journal of Climatology, 28(15), 2031–2064. https://doi.org/10.1002/joc.1688
11 Vicente-Serrano, S. M., Beguería, S., & López-Moreno, J. I. (2010). A multiscalar drought index sensitive to global warming: The standardized precipitation evapotranspiration index. Journal of Climate, 23(7), 1696–1718. https://doi.org/10.1175/2009JCLI2909.1
Learn about other indicators in this section