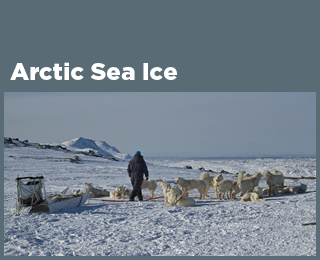
Climate Change Indicators: Arctic Sea Ice
This indicator tracks the extent, age, and melt season of sea ice in the Arctic Ocean.
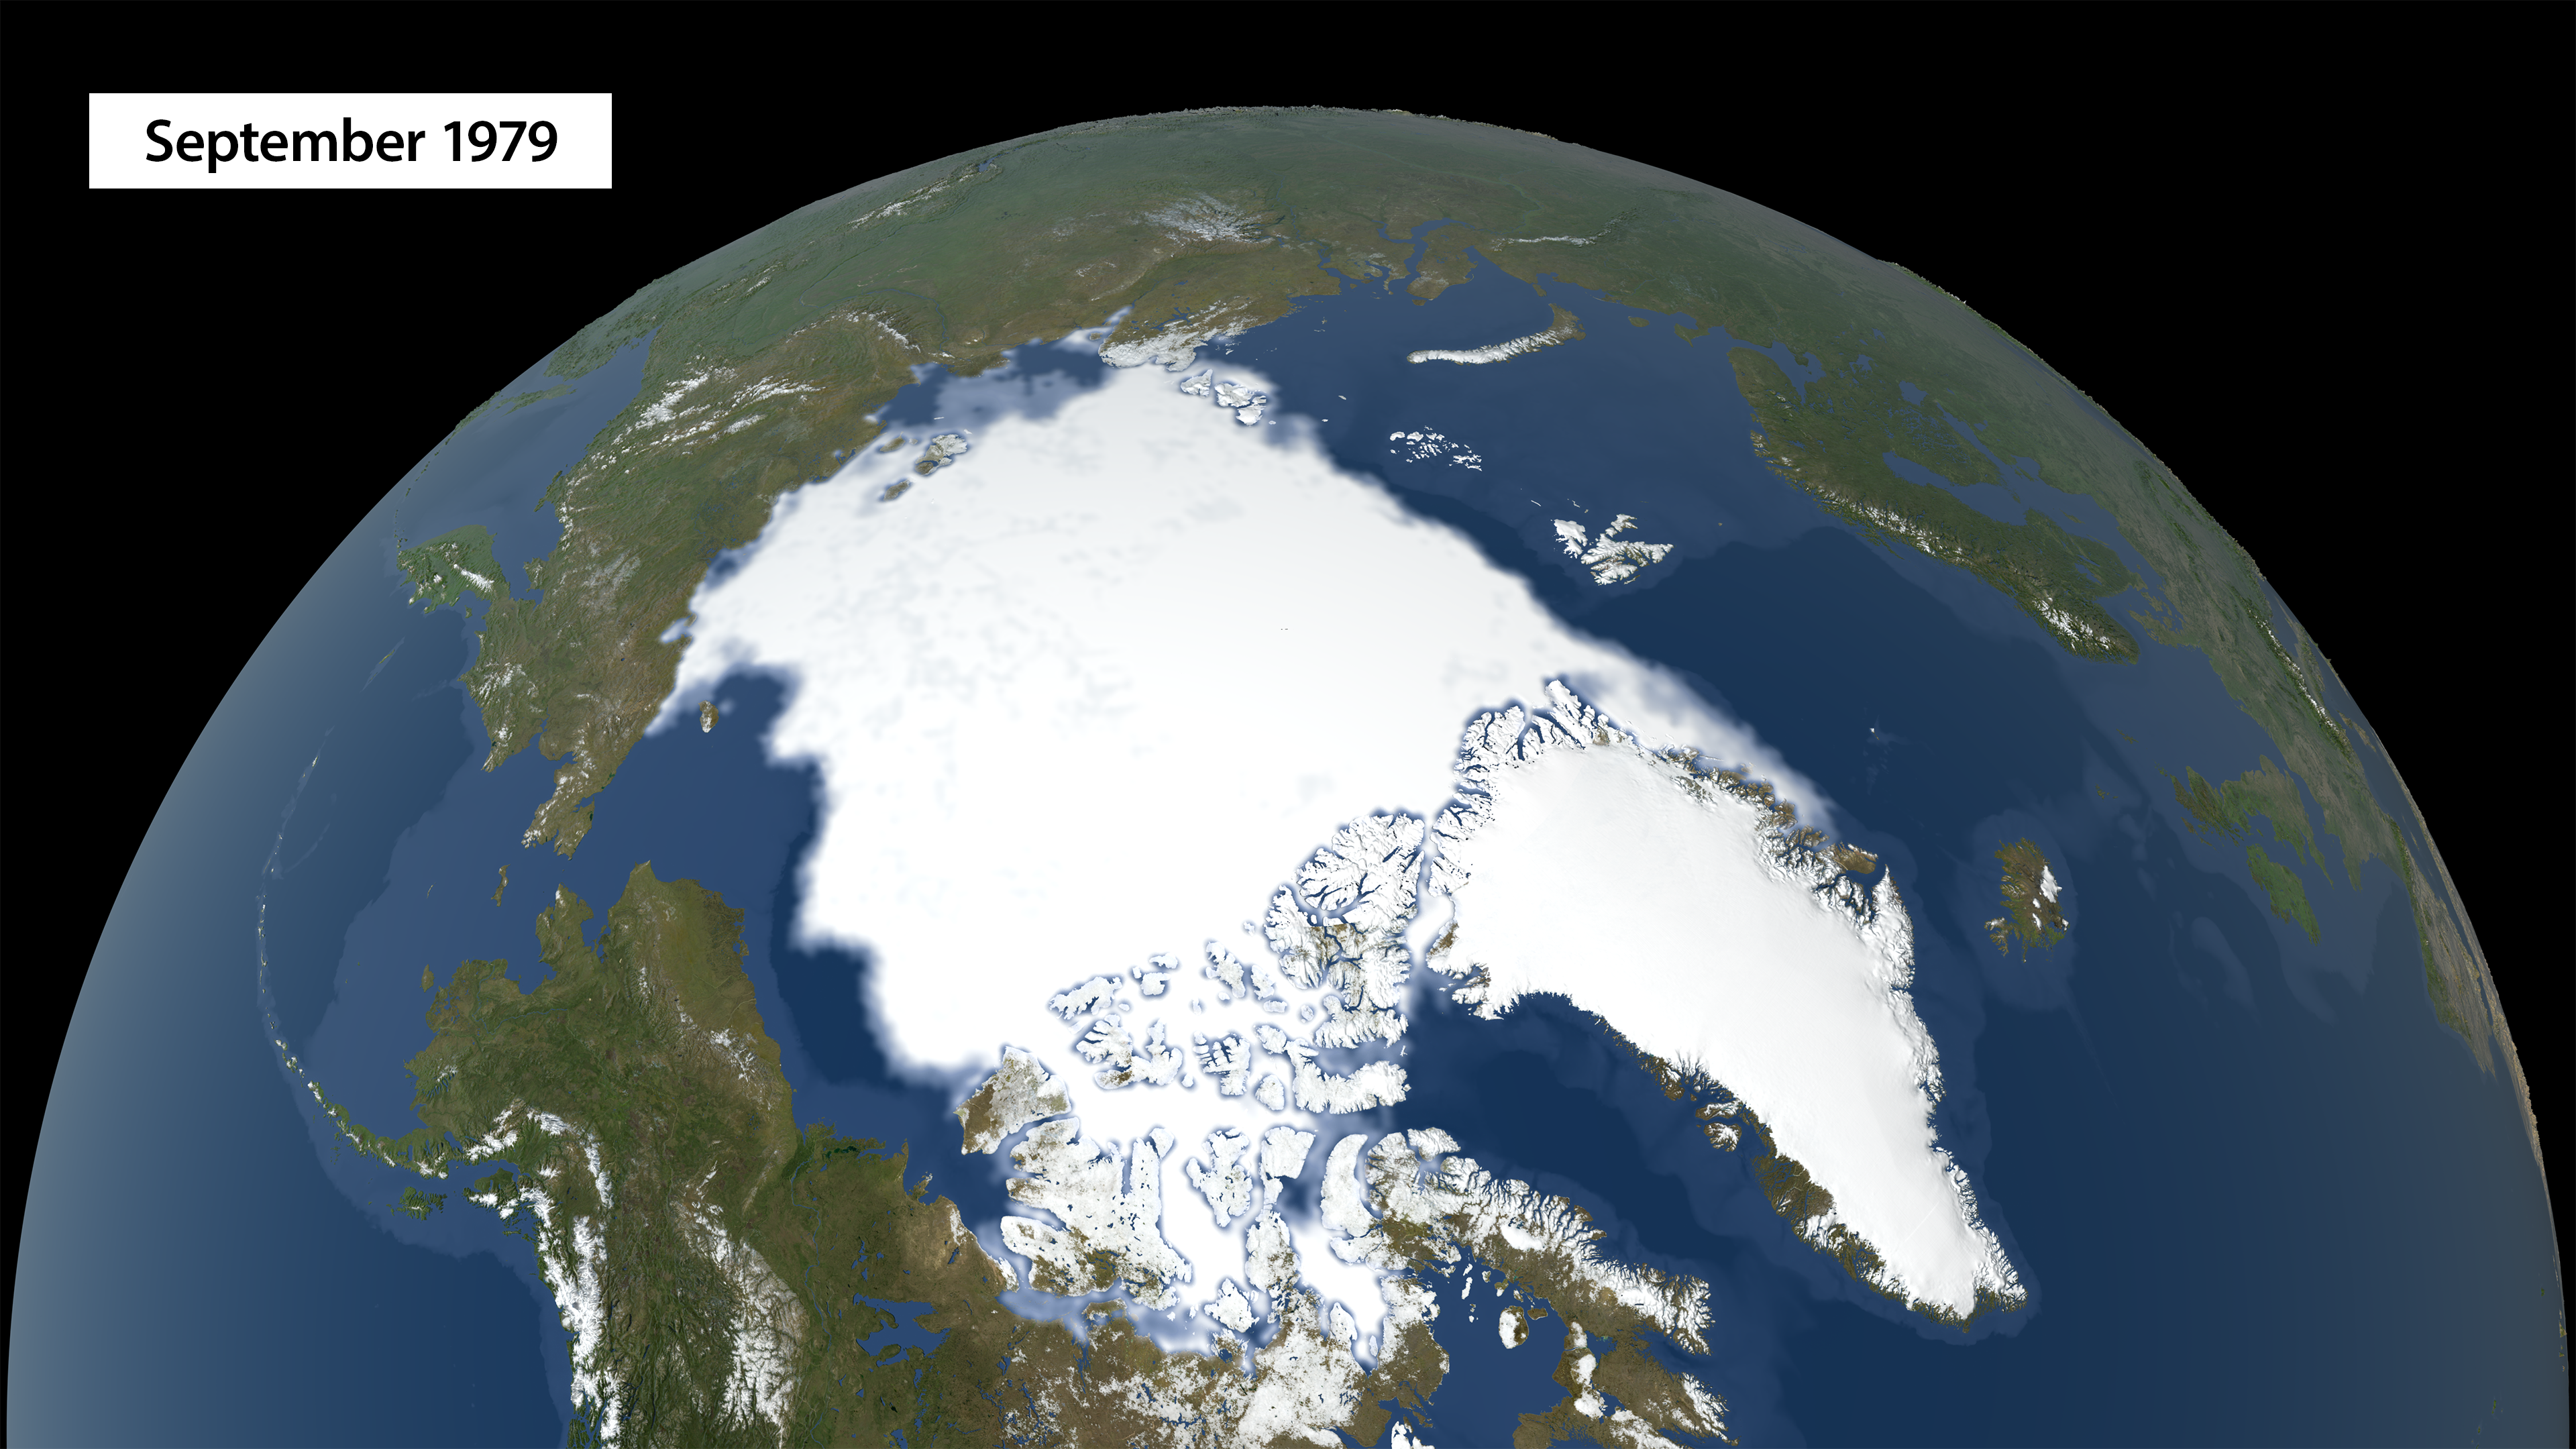
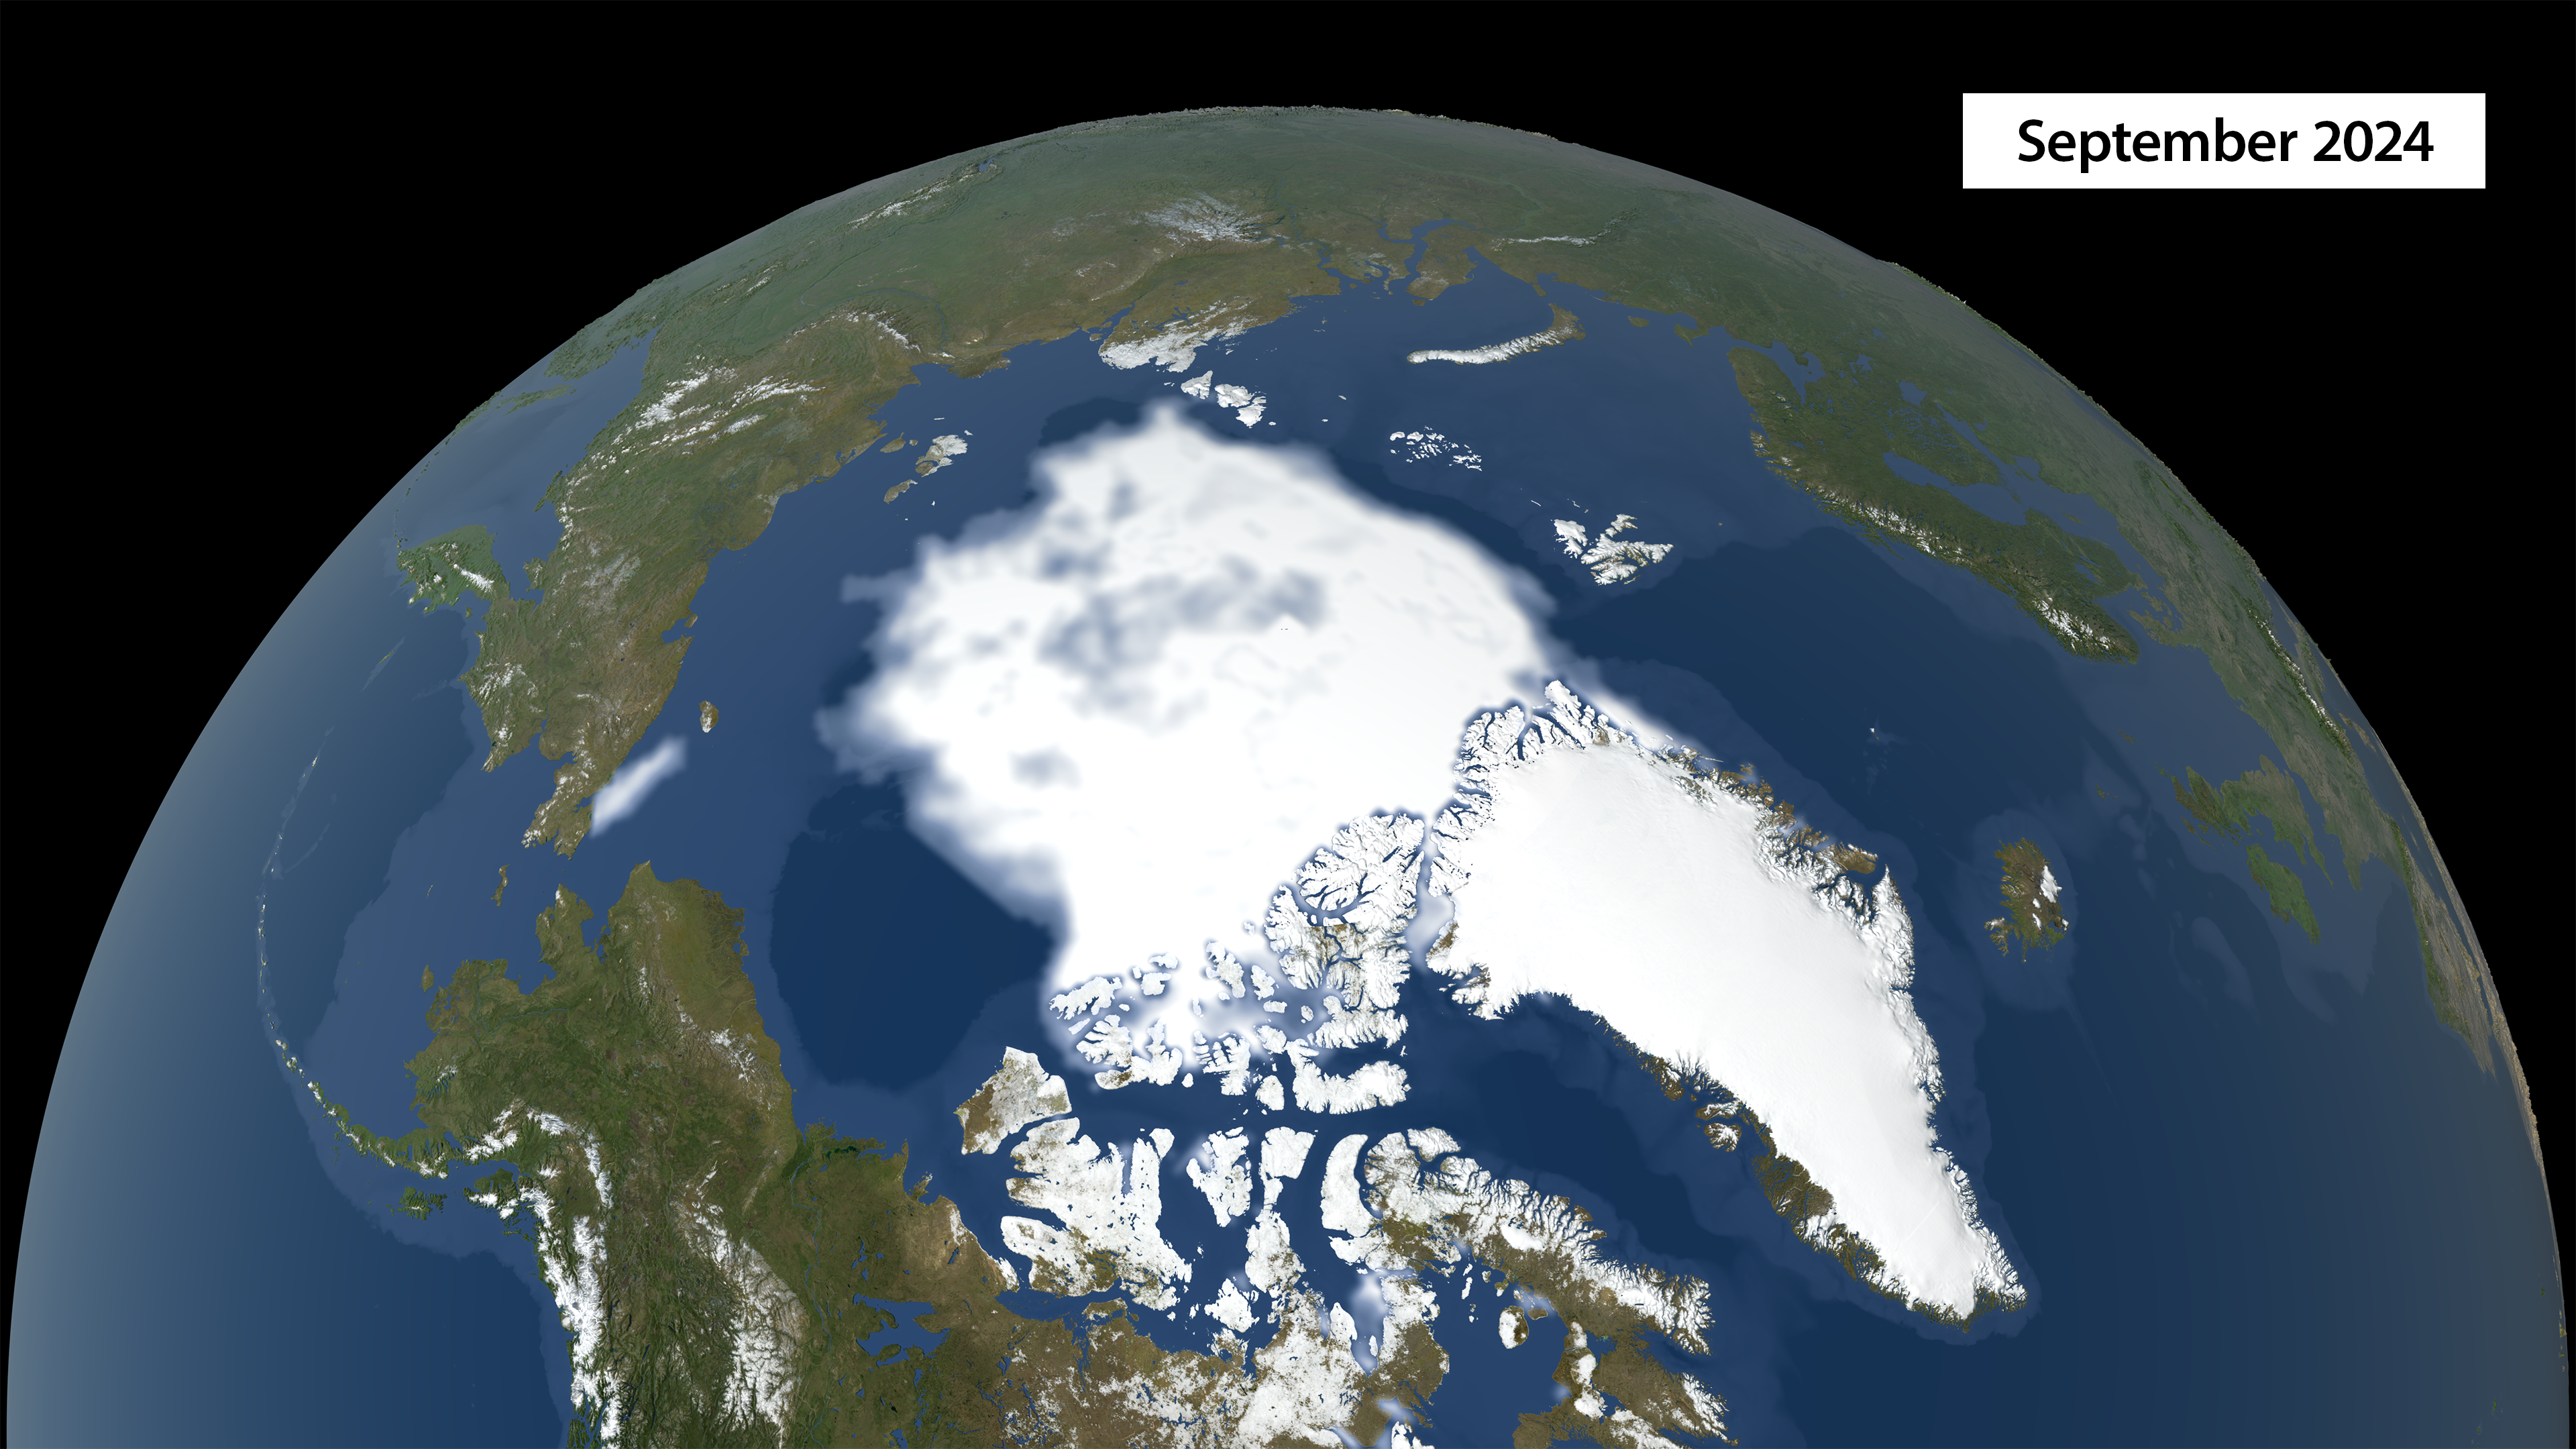
Use the slider to compare sea ice coverage in the Arctic region between the first and most recent year of data. September is when the minimum extent typically occurs each year.
Source: NASA, 20243
Web update: December 2024
Key Points
- September 2012 had the lowest sea ice extent ever recorded, 44 percent below the 1981–2010 average for that month. For March, the lowest sea ice extent on record was in 2017, 7.4 percent less than the 1981–2010 average (Figure 1).
- The September 2024 sea ice extent was the sixth smallest on record. It was about 785,000 square miles less than the historical 1981–2010 average for that month (Figure 1)—a difference almost three times the size of Texas.
- All months have shown a negative trend in sea ice extent over the past several decades. The largest year-to-year decreases have occurred in the summer and fall months.4,5
- Evidence suggests that fewer patches of older, thicker sea ice are surviving through one or more melt seasons and persisting through multiple years (Figure 2). The proportion of sea ice five years old or older has declined dramatically over the recorded time period, from more than 40 percent of September ice on average in the 1980s to less than 10 percent since 2010. A growing percentage of Arctic sea ice is only one or two years old. Less old multi-year ice implies that the ice cover is thinning, which makes it more vulnerable to further melting.
- Since 1979, the length of the Arctic sea ice melt season has grown by about 40 days (Figure 3). On average, Arctic sea ice now starts melting eight days earlier and starts refreezing 31 days later than it has historically (Figure 3).
Background
Sea ice, which is sea water that freezes from the ocean surface down to several feet below, is an integral part of the Arctic Ocean. During the dark winter months, sea ice essentially covers the entire Arctic Ocean. In summer, some of this ice melts because of warmer temperatures and long hours of sunlight. Sea ice typically reaches its minimum thickness and extent in mid-September, when the area covered by ice is roughly half the size of the winter maximum. The ice then begins to expand again during fall and winter when temperatures decrease and sunlight is limited.
The extent of area covered by Arctic sea ice is an important indicator of changes in global climate because warmer air and water temperatures are reducing the amount of sea ice present. Because sea ice is light-colored, it reflects more sunlight (solar energy) back to space than liquid water, thereby playing an important role in maintaining the Earth’s energy balance and helping to keep polar regions cool. (For more information on the effects of surface color on reflecting sunlight, see the Snow Cover indicator.) Sea ice also keeps the air cool by forming a barrier between the cold air above and the relatively warmer water below. As the amount of sea ice decreases due to the oceans absorbing more solar energy, the cooling effect of this ice is reduced, which can magnify the original warming. The magnified warming then leads to even more loss of sea ice.
The age of sea ice is also an important indicator of Arctic conditions, because ice that has accumulated over many years is generally thicker and stronger than younger ice. A loss of older ice suggests that the Arctic ice cover is becoming thinner. Evidence also suggests that the melt season has become longer; the ice is starting to melt earlier in the year and freeze later than it used to.1
Changes in sea ice can directly affect the health of Arctic ecosystems. Mammals such as polar bears and walruses rely on the presence of sea ice for hunting, breeding, and migrating. These animals face the threat of declining birth rates and restricted access to food sources because of reduced sea ice coverage and thickness. Impacts on Arctic wildlife, as well as the loss of ice itself, are already restricting the traditional subsistence hunting lifestyle of indigenous Arctic populations such as the Yup’ik, Iñupiat, and Inuit.
While diminished sea ice can have negative ecological effects, it can also present commercial and economic opportunities. For instance, reduced sea ice opens shipping lanes and increases access to natural resources in the Arctic region.2
About the Indicator
Figure 1 shows Arctic sea ice extent from 1979, when routine monitoring by satellites started, to 2024. Sea ice extent is defined as the area of ocean where at least 15 percent of the surface is frozen. This threshold was chosen because scientists have found that it gives the best approximation of the edge of the ice. While data are collected throughout the year, this indicator focuses on the months when sea ice typically reaches its minimum and maximum extent. September is typically when the sea ice extent reaches its annual minimum after melting during the spring and summer. Conversely, March is typically when sea ice reaches its maximum extent after winter freezing. Data for this indicator were gathered by the National Snow and Ice Data Center using satellite imaging technology and data processing methods developed by the National Aeronautics and Space Administration.
Figure 2 examines the age of the ice that is present in the Arctic during the one week in September that has the smallest extent of ice. By combining daily satellite images, wind measurements, and data from surface buoys that move with the ice, scientists can track specific parcels of ice as they move over time. This tracking enables them to calculate the age of the ice in different parts of the Arctic. Although satellites started collecting data in 1979, Figure 2 only shows data back to 1984 because it is not possible to know the full age distribution until the ice has been tracked for at least five years.
Figure 3 shows the start and end dates of each year’s Arctic sea ice melt season, starting in 1979. It is based on the same satellite instruments as Figure 1. Here, the melt season start date is defined as the date when satellites detect consistent wetness on the surface of the ice and snow; the end date is when the surface air temperature stays consistently at or below the freezing point and ice begins to grow in the open ocean.
About the Data
Indicator Notes
Increasing air and ocean temperatures associated with climate change are not the only factors contributing to reductions in sea ice. Other conditions that may be affected by climate change, such as fluctuations in oceanic and atmospheric circulation, and natural annual and decadal variability, also affect the extent of sea ice. Determining the age of ice is an imperfect science, as there are cases where a small amount of older ice might exist within an area classified as younger, or vice versa.
Data Sources
The data for Figures 1 and 2 were provided by the National Snow and Ice Data Center, which produces a variety of reports and a seasonal newsletter analyzing Arctic sea ice data. Data for Figure 1 are available online at: https://nsidc.org/data/seaice_index, while Figure 2 is based on an analysis by the University of Colorado that is typically updated each year at: https://nsidc.org/arcticseaicenews. Figure 3 data were provided by the National Aeronautics and Space Administration based on an analysis typically updated each year at: https://earth.gsfc.nasa.gov/cryo/data/arctic-sea-ice-melt.
Technical Documentation
References
1. IPCC (Intergovernmental Panel on Climate Change). (2021). Climate change 2021—The physical science basis: Working Group I contribution to the Sixth Assessment Report of the Intergovernmental Panel on Climate Change (V. Masson-Delmotte, P. Zhai, A. Pirani, S. L. Connors, C. Péan, S. Berger, N. Caud, Y. Chen, L. Goldfarb, M. I. Gomis, M. Huang, K. Leitzell, E. Lonnoy, J. B. R. Matthews, T. K. Maycock, T. Waterfield, O. Yelekçi, R. Yu, & B. Zhou, Eds.). Cambridge University Press. https://doi.org/10.1017/9781009157896
2. Berkman, P. A., Fiske, G. J., Lorenzini, D., Young, O. R., Pletnikoff, K., Grebmeier, J. M., Fernandez, L. M., Divine, L. M., Causey, D., Kaspar, K. E., & Jørgensen, L. L. (2023). Satellite record of pan-Arctic maritime ship traffic. https://arctic.noaa.gov/report-card/report-card-2022/satellite-record-of-pan-arctic-maritime-ship-traffic
3. NASA (National Aeronautics and Space Administration). (2024). Scientific Visualization Studio. https://svs.gsfc.nasa.gov
4. NSIDC (National Snow and Ice Data Center). (2024). Sea ice: Why it matters. https://nsidc.org/learn/parts-cryosphere/sea-ice/why-sea-ice-matters
5. Comiso, J. C. (2012). Large decadal decline of the Arctic multiyear ice cover. Journal of Climate, 25(4), 1176–1193. https://doi.org/10.1175/JCLI-D-11-00113.1
6. NSIDC (National Snow and Ice Data Center). (2024). Data and image archive. Retrieved December 11, 2024, from https://nsidc.org/data/seaice_index/data-and-image-archive
7. NSIDC (National Snow and Ice Data Center). (2021, April 10). Sea ice age. https://nsidc.org/data/soac/sea-ice-age
8. NSIDC (National Snow and Ice Data Center). (2024, November 15). Update to NSIDC. (2023). EASE-Grid sea ice age, version 4 [Data set]. https://nsidc.org/data/nsidc-0611/versions/4
9. NASA (National Aeronautics and Space Administration). (2024, December 17). Update to NASA. (2023). Arctic sea ice melt. https://earth.gsfc.nasa.gov/cryo/data/arctic-sea-ice-melt
Learn about other indicators in this section