Climate Change Indicators: Sea Level
This indicator describes how sea level has changed over time. The indicator describes two types of sea level changes: absolute and relative.
Figure 2. Relative Sea Level Change Along U.S. Coasts, 1960–2023
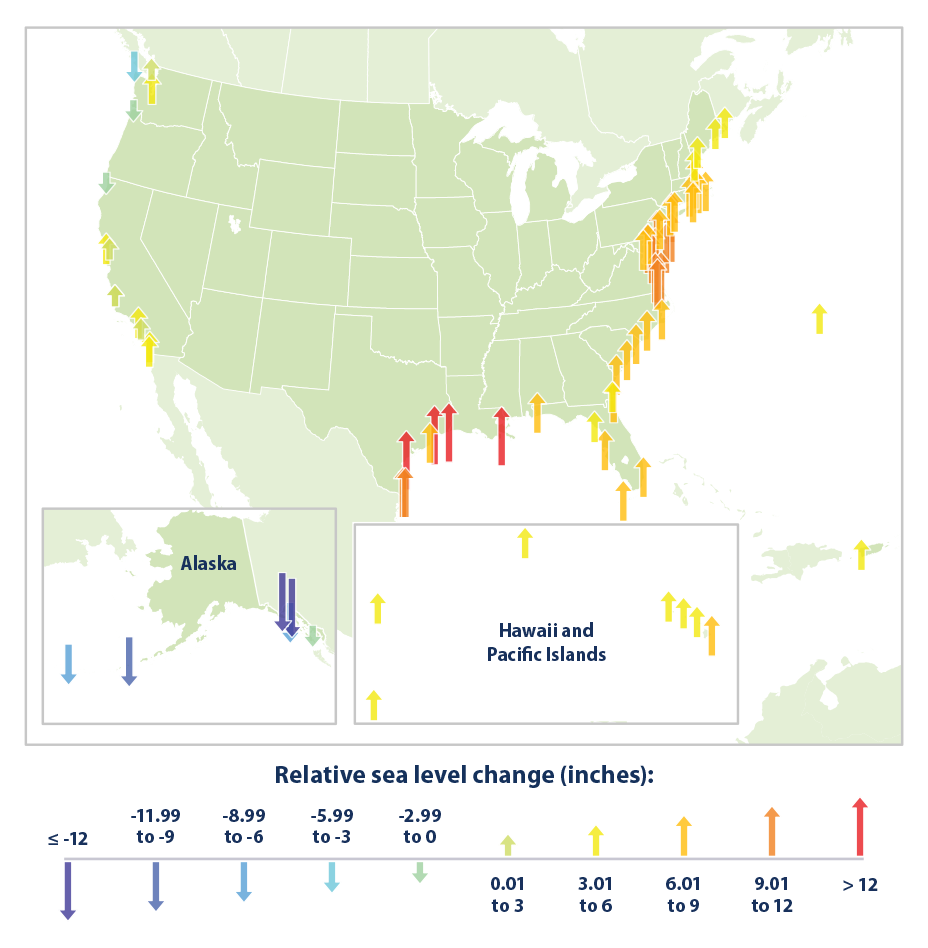
This map shows cumulative changes in relative sea level from 1960 to 2023 at tide gauge stations along U.S. coasts. Relative sea level reflects changes in sea level as well as land elevation.
Data source: NOAA, 20246
Web update: June 2024
Key Points
- After a period of approximately 2,000 years of little change (not shown here), global average sea level rose throughout the 20th century, and the rate of change has accelerated in recent years.2 When averaged over all of the world’s oceans, absolute sea level rose at an average rate of 0.06 inches per year from 1880 to 2013 (Figure 1). Since 1993, however, average sea level rose at a rate of 0.12 inches per year—roughly twice as fast as the long-term trend.
- Relative sea level rose along much of the U.S. coastline between 1960 and 2023, particularly the Mid-Atlantic coast and parts of the Gulf coast, where some stations recorded increases of more than 8 inches (Figure 2). Meanwhile, relative sea level fell at some locations in Alaska and the Pacific Northwest. At those sites, even though absolute sea level has risen, land elevation has risen more rapidly.
- While absolute sea level has increased steadily overall, particularly in recent decades, regional trends vary, and absolute sea level has decreased in some places.3 Relative sea level also has not risen uniformly because of regional and local changes in land movement and long-term changes in coastal circulation patterns.
Background
As the temperature of the Earth changes, so does sea level. Temperature and sea level are linked for two main reasons:
- Changes in the volume of water and ice on land (namely glaciers and ice sheets) can increase or decrease the volume of water in the ocean (see the Glaciers indicator).
- As water warms, it expands slightly—an effect that is cumulative over the entire depth of the oceans (see the Ocean Heat indicator).
Changing sea levels can affect human activities in coastal areas. Rising sea level inundates low-lying wetlands and dry land, erodes shorelines, contributes to coastal flooding, and increases the flow of salt water into estuaries and nearby groundwater aquifers. Higher sea level also makes coastal infrastructure more vulnerable to damage from storms.
The sea level changes that affect coastal systems involve more than just expanding oceans, however, because the Earth’s continents can also rise and fall relative to the oceans. Land can rise through processes such as sediment accumulation (the process that built the Mississippi River delta) and geological uplift (for example, as glaciers melt and the land below is no longer weighed down by heavy ice). In other areas, land can sink because of erosion, sediment compaction, natural subsidence (sinking due to geologic changes), groundwater withdrawal, or engineering projects that prevent rivers from naturally depositing sediments along their banks. Changes in ocean currents such as the Gulf Stream can also affect sea levels by pushing more water against some coastlines and pulling it away from others, raising or lowering sea levels accordingly.
Scientists account for these types of changes by measuring sea level change in two different ways. Relative sea level change refers to how the height of the ocean rises or falls relative to the land at a particular location. In contrast, absolute sea level change refers to the height of the ocean surface above the center of the earth, without regard to whether nearby land is rising or falling. Evidence suggests sea level along the U.S. coastline will rise 10 to 12 inches by 2050—as much as the rise measured from 1920 to 2020.1 (The 10 to 12 inches are an average: differences in both land and ocean height mean the rise will vary regionally along U.S. coasts.)
About the Indicator
This indicator presents trends in sea level based on measurements from tide gauges and from satellites that orbit the Earth. Tide gauges measure relative sea level change at points along the coast, while satellite instruments measure absolute sea level change over nearly the entire ocean surface. Many tide gauges have collected data for more than 100 years, while satellites have collected data since the early 1990s.
Figure 1 shows annual absolute sea level change averaged over the entire Earth’s ocean surface. The long-term trend is based on tide gauge data that have been adjusted to show absolute global trends through calibration with recent satellite data. This long-term data set has been calculated through 2013, while satellite data are now available through the end of 2023. Figure 2 shows trends at a more local scale, highlighting the 1960 to 2023 change in relative sea level at 72 tide gauges along the Atlantic, Pacific, and Gulf coasts of the United States.
About the Data
Indicator Notes
Relative sea level trends represent a combination of absolute sea level change and any local land movement. Tide gauge measurements such as those in Figure 2 generally cannot distinguish between these two different influences without an accurate measurement of vertical land motion nearby.
Some changes in relative and absolute sea level can be due to multi-year cycles such as El Niño and La Niña, which affect coastal ocean temperatures, salt content, wind patterns, atmospheric pressure (and thus storm tracks), and currents. Obtaining a reliable trend can require many years of data, which is why the satellite record in Figure 1 has been supplemented with a longer-term reconstruction based on tide gauge measurements.
Data Sources
Absolute sea level trends were provided by Australia’s Commonwealth Scientific and Industrial Research Organisation and the National Oceanic and Atmospheric Administration. These data are based on measurements collected by satellites and tide gauges. Relative sea level data are available from the National Oceanic and Atmospheric Administration, which publishes an interactive online map (https://tidesandcurrents.noaa.gov/sltrends/sltrends.html) with links to detailed data for each tide gauge.
Technical Documentation
References
1 Sweet, W. V., Hamlington, B. D., Kopp, R. E., Weaver, C. P., Barnard, P. L., Bekaert, D., Brooks, W., Craghan, M., Dusek, G., Frederikse, T., Garner, G., Genz, A. S., Krasting, J. P., Larour, E., Marcy, D., Marra, J. J., Obeysekera, J., Osler, M., Pendleton, M., … Zuzak, C. (2022). Global and regional sea level rise scenarios for the United States: Updated mean projections and extreme water level probabilities along U.S. coastlines (NOAA Technical Report NOS 01). National Oceanic and Atmospheric Administration. https://oceanservice.noaa.gov/hazards/sealevelrise/sealevelrise-tech-report.html
2 Sweet, W. V., Horton, R., Kopp, R. E., LeGrande, A. N., & Romanou, A. (2017). Chapter 12: Sea level rise. In USGCRP (U.S. Global Change Research Program), Climate science special report: Fourth National Climate Assessment, volume I (pp. 333–363). https://doi.org/10.7930/J0VM49F2
3 Sea Level Research Group. (2024). Trend map. Retrieved May 17, 2024, from https://sealevel.colorado.edu/trend-map
4. CSIRO (Commonwealth Scientific and Industrial Research Organisation). (2017). Update to data originally published in: Church, J. A., & White, N. J. (2011). Sea-level rise from the late 19th to the early 21st century. Surveys in Geophysics, 32, 585–602. www.cmar.csiro.au/sealevel/sl_data_cmar.html
5. NOAA (National Oceanic and Atmospheric Administration). (2024). Laboratory for Satellite Altimetry: Sea level rise. Retrieved March 1, 2024, from www.star.nesdis.noaa.gov/sod/lsa/SeaLevelRise/LSA_SLR_timeseries_global.php
6. NOAA (National Oceanic and Atmospheric Administration). (2024). Update to data originally published in: NOAA. (2009). Sea level variations of the United States 1854–2006 (NOAA Technical Report NOS CO-OPS 053). www.tidesandcurrents.noaa.gov/publications/Tech_rpt_53.pdf
Learn about other indicators in this section