Climate Change Indicators: Glaciers
This indicator examines the balance between snow accumulation and melting in glaciers, and it describes how glaciers in the United States and around the world have changed over time.
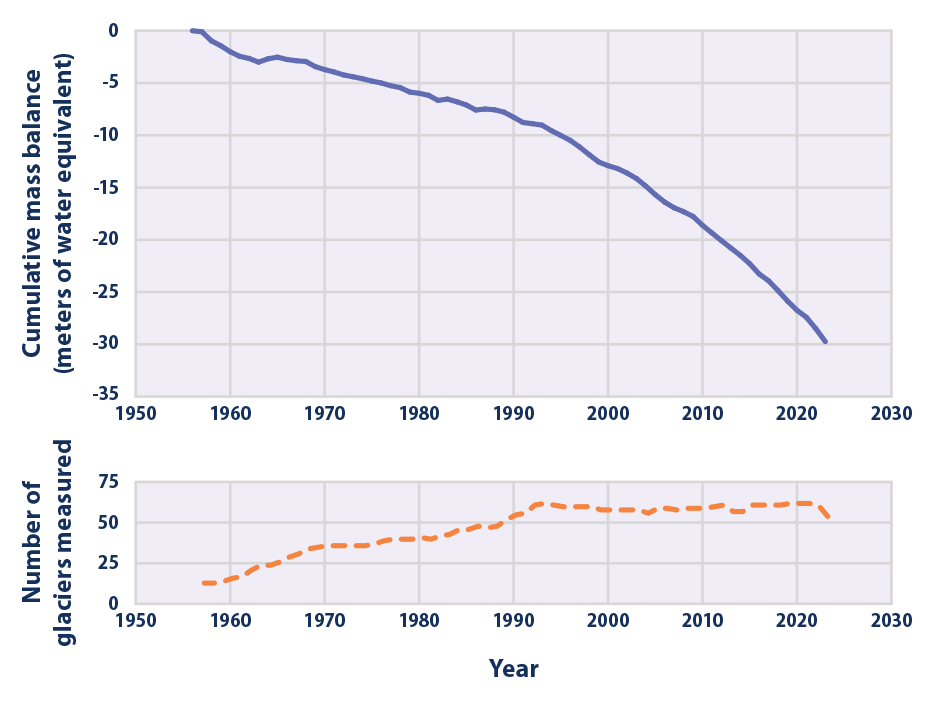
This figure shows the cumulative change in mass balance of a set of “reference” glaciers worldwide beginning in 1956. The line on the upper graph represents the average of all the glaciers that were measured. Negative values indicate a net loss of ice and snow compared with the base year of 1956. For consistency, measurements are in meters of water equivalent, which represent changes in the average thickness of a glacier. The small chart below shows how many glaciers were measured in each year. Some glacier measurements have not yet been finalized for the last few years, hence the smaller number of sites.
Data source: WGMS, 20245
Web update: June 2024
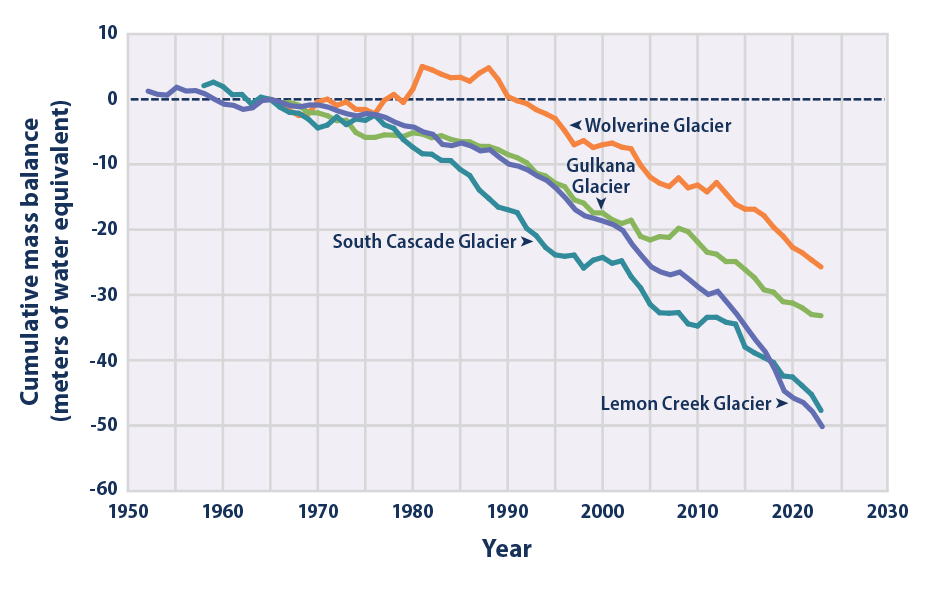
 This figure shows the cumulative mass balance of four U.S. reference glaciers since measurements began in the 1950s or 1960s. For each glacier, the mass balance is set at zero for the base year of 1965. Negative values indicate a net loss of ice and snow compared with the base year. For consistency, measurements are in meters of water equivalent, which represent changes in the average thickness of a glacier.
Data source: USGS, 20246
Web update: June 2024
Key Points
- On average, glaciers worldwide have been losing mass since at least the 1970s (see Figure 1), which in turn has contributed to observed changes in sea level (see the Sea Level indicator). A longer measurement record from a smaller number of glaciers suggests that they have been shrinking since the 1950s. The rate at which glaciers are losing mass appears to have accelerated over roughly the last decade.
- The four U.S. reference glaciers have shown an overall decline in mass balance since the 1950s and 1960s and an accelerated rate of decline in recent years (see Figure 2). Year-to-year trends vary, with some glaciers gaining mass in certain years (for example, Wolverine Glacier during the 1980s), but the measurements clearly indicate a loss of glacier mass over time.
- Trends for the four U.S. reference glaciers are consistent with the retreat of glaciers observed throughout the western United States, Alaska, and other parts of the world.1,4 Observations of glaciers losing mass are also consistent with warming trends in U.S. and global temperatures during this time period (see the U.S. and Global Temperature indicator).
Background
A glacier is a large mass of snow and ice that has accumulated over many years and is present year-round. In the United States, glaciers can be found in the Rocky Mountains, the Sierra Nevada, the Cascades, and throughout Alaska. A glacier flows naturally like a river, only much more slowly. At higher elevations, glaciers accumulate snow, which eventually becomes compressed into ice. At lower elevations, the “river” of ice naturally loses mass because of melting and ice breaking off and floating away (iceberg calving) if the glacier ends in a lake or the ocean. When melting and calving are exactly balanced by new snow accumulation, a glacier is in equilibrium and its mass will neither increase nor decrease.
In many areas, glaciers provide communities and ecosystems with a reliable source of streamflow and drinking water, particularly in times of extended drought and late in the summer, when seasonal snowpack has melted away. Freshwater runoff from glaciers also influences ocean ecosystems. Glaciers are important as an indicator of climate change because physical changes in glaciers—whether they are growing or shrinking, advancing or receding—provide visible evidence of changes in temperature and precipitation. If glaciers lose more ice than they can accumulate through new snowfall, they ultimately add more water to the oceans, leading to a rise in sea level (see the Sea Level indicator). The same kinds of changes occur on a much larger scale within the giant ice sheets that cover Greenland and Antarctica, potentially leading to even bigger implications for sea level. Small glaciers tend to respond more quickly to climate change than the giant ice sheets. Altogether, the world’s small glaciers are adding roughly the same amount of water to the oceans per year as the ice sheets of Greenland and Antarctica combined. Between 1971 and 2018, they added more water overall to the oceans than the ice sheets did.1
About the Indicator
This indicator is based on long-term monitoring data collected at selected glaciers around the world. Scientists collect detailed measurements to determine glacier mass balance, which is the net gain or loss of snow and ice over the course of the year. A negative mass balance indicates that a glacier has lost ice or snow. If cumulative mass balance becomes more negative over time, it means glaciers are losing mass more quickly than they can accumulate new snow.
Figure 1 shows trends in mass balance for a set of 61 reference glaciers around the world that have been measured consistently since the 1970s, including several that have been measured since the 1950s. Data from these reference glaciers have been averaged together to depict changes over time. Figure 2 shows trends for four of these reference glaciers that are located in the United States. South Cascade Glacier in Washington state, Lemon Creek Glacier in southeastern Alaska, Wolverine Glacier near Alaska’s southern coast, and Gulkana Glacier in Alaska’s interior are all part of the U.S. Geological Survey’s longstanding “benchmark” glacier program. These four glaciers were chosen because they have been studied extensively for many years and because they are thought to be representative of other glaciers nearby.
This indicator describes the change in glacier mass balance, which is measured as the average change in thickness across the surface of a glacier. The change in ice or snow has been converted to the equivalent amount of liquid water.
About the Data
Indicator Notes
The relationship between climate change and glacier mass balance is complex, and the observed changes at specific reference or benchmark glaciers might reflect a combination of global and local variations in temperature and precipitation. Individual glaciers also vary in their structure, flow, and response to climate. Slightly different measurement and analysis methods have been used at different glaciers, but overall trends appear to be similar.
Long-term measurements are available for only a relatively small percentage of the world’s glaciers. This indicator does not include the Greenland and Antarctic ice sheets, although EPA’s Ice Sheets indicator shows that they are also experiencing a net loss of ice.
Data Sources
The World Glacier Monitoring Service compiled data for Figure 1, based on measurements collected by a variety of organizations around the world. The U.S. Geological Survey Benchmark Glacier Program provided the data for the four glaciers in Figure 2. Historical data, as well as periodic reports and measurements of the reference glaciers, are available at: https://alaska.usgs.gov/products/data.php?dataid=79 and https://wgms.ch.
Technical Documentation
References
1 IPCC (Intergovernmental Panel on Climate Change). (2021). Climate change 2021—The physical science basis: Working Group I contribution to the Sixth Assessment Report of the Intergovernmental Panel on Climate Change (V. Masson-Delmotte, P. Zhai, A. Pirani, S. L. Connors, C. Péan, S. Berger, N. Caud, Y. Chen, L. Goldfarb, M. I. Gomis, M. Huang, K. Leitzell, E. Lonnoy, J. B. R. Matthews, T. K. Maycock, T. Waterfield, O. Yelekçi, R. Yu, & B. Zhou, Eds.). Cambridge University Press. https://doi.org/10.1017/9781009157896
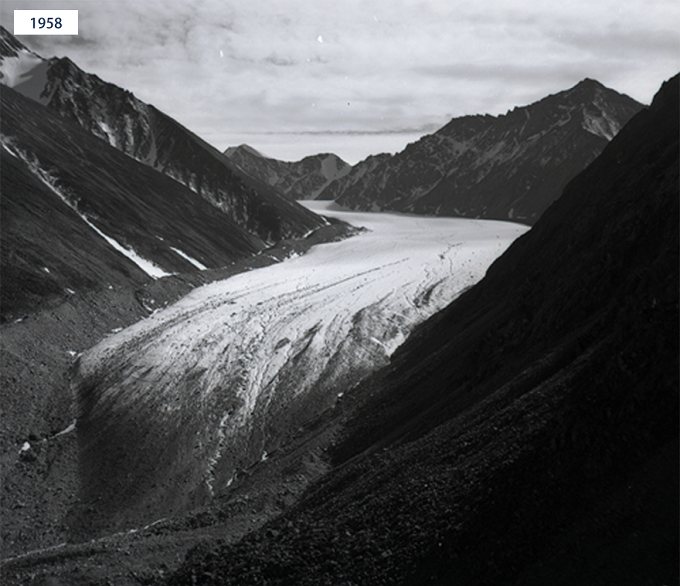
2 Post, A. (1958). McCall Glacier [Photograph]. Glacier Photograph Collection. https://nsidc.org/data/glacier_photo/index.html
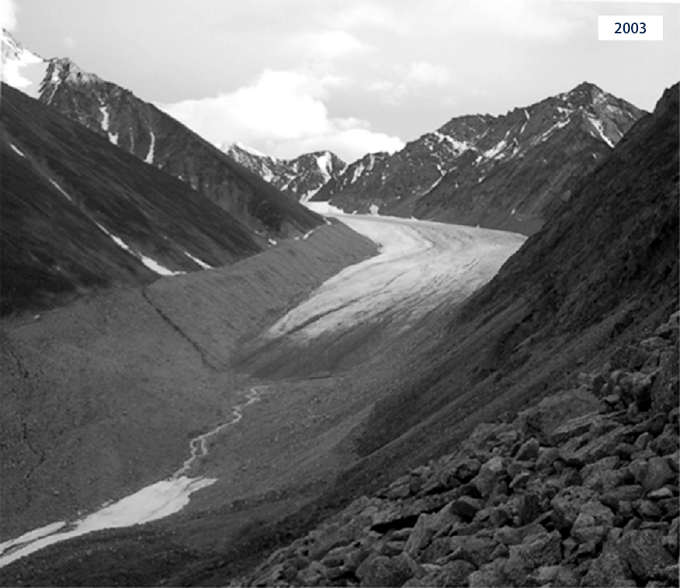
3 Nolan, M. (2003). McCall Glacier [Photograph]. Glacier Photograph Collection.
https://nsidc.org/data/glacier_photo/index.html
4 Marvel, K., Su, W., Delgado, R., Aarons, S., Chatterjee, A., Garcia, M. E., Hausfather, Z., Hayhoe, K., Hence, D. A., Jewett, E. B., Robel, A., Singh, D., Tripati, A., & Vose, R. S. (2023). Chapter 2: Climate trends. In USGCRP (U.S. Global Change Research Program), Fifth National Climate Assessment. https://doi.org/10.7930/NCA5.2023.CH2
5 WGMS (World Glacier Monitoring Service). (2024). Fluctuations of Glaciers Database [Data set]. Retrieved February 20, 2024, from https://wgms.ch/data_databaseversions
6 USGS (U.S. Geological Survey). (2024). Glacier-wide mass balance and compiled data inputs (8.1) [Data set]. Retrieved February 20, 2024, from https://alaska.usgs.gov/products/data.php?dataid=79
Learn about other indicators in this section