U.S. flag

An official website of the United States government

Here’s how you know

Dot gov

Official websites use .gov
A .gov website belongs to an official government organization in the United States.

HTTPS

Secure .gov websites use HTTPS
A lock (LockA locked padlock) or https:// means you’ve safely connected to the .gov website. Share sensitive information only on official, secure websites.

    • Environmental Topics
    • Air
    • Bed Bugs
    • Cancer
    • Chemicals, Toxics, and Pesticide
    • Emergency Response
    • Environmental Information by Location
    • Health
    • Land, Waste, and Cleanup
    • Lead
    • Mold
    • Radon
    • Research
    • Science Topics
    • Water Topics
    • A-Z Topic Index
    • Laws & Regulations
    • By Business Sector
    • By Topic
    • Compliance
    • Enforcement
    • Laws and Executive Orders
    • Regulations
    • Report a Violation
    • Environmental Violations
    • Fraud, Waste or Abuse
    • About EPA
    • Our Mission and What We Do
    • Headquarters Offices
    • Regional Offices
    • Labs and Research Centers
    • Planning, Budget, and Results
    • Organization Chart
    • EPA History

Breadcrumb

  1. Home
  2. Climate Change Indicators
  3. View the Indicators
  4. Weather and Climate

A Closer Look: Temperature and Drought in the Southwest

This feature provides a closer look at trends in temperature and drought in the southwestern United States.

Figure 1. Average Temperatures in the Southwestern United States, 2000–2023 Versus Long-Term Average
Map showing how the average air temperature from 2000 to 2023 in six southwestern states differed from the long-term average.
Download Data  Download Image  View Interactive Map

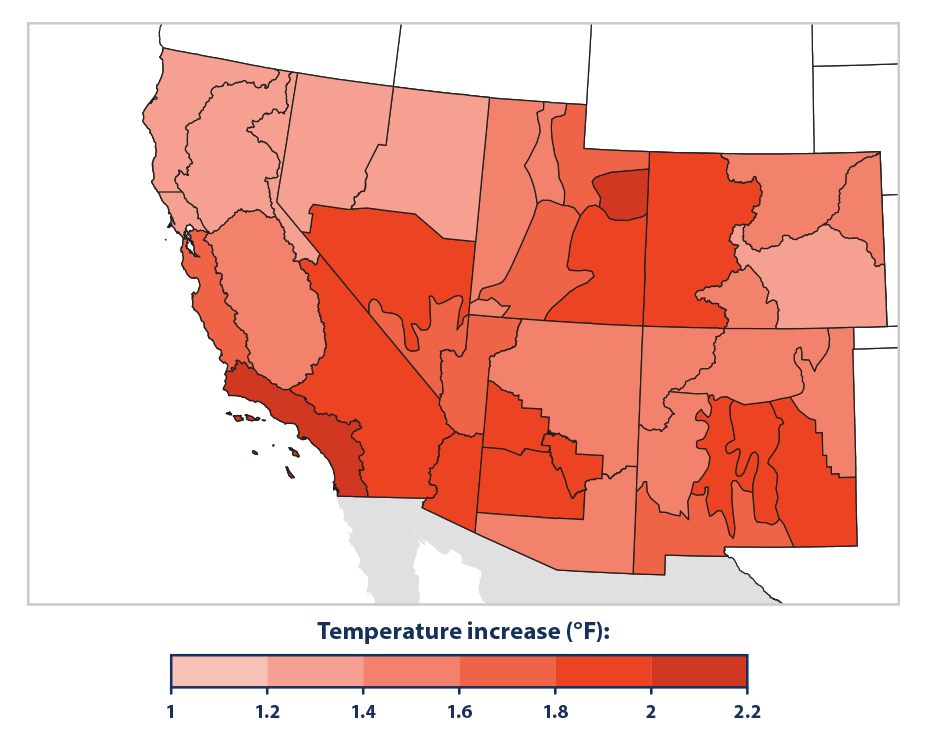
This map shows how the average air temperature from 2000 to 2023 has differed from the long-term average (1895–2023). To provide more detailed information, each state has been divided into climate divisions, which are zones that share similar climate features.

Data source: NOAA, 20242
Web update: December 2024


This chart shows the percentage of land area in six southwestern states (Arizona, California, Colorado, Nevada, New Mexico, and Utah) classified under drought conditions from 2000 through 2023. This figure uses the U.S. Drought Monitor classification system, which is described in the table in the Drought indicator.


This chart shows annual values of the Palmer Drought Severity Index, averaged over six states in the Southwest (Arizona, California, Colorado, Nevada, New Mexico, and Utah). Positive values represent wetter-than-average conditions, while negative values represent drier-than-average conditions. A value between -2 and -3 indicates moderate drought, -3 to -4 is severe drought, and -4 or below indicates extreme drought. The thicker line is a nine-year weighted average.

Key Points | Background | About the Data | Technical Documentation

Key Points

  • Every part of the Southwest experienced higher average temperatures between 2000 and 2023 than the long-term average (1895–2023). Some areas were more than 2°F warmer than average (see Figure 1).
  • Large portions of the Southwest have experienced drought conditions since weekly Drought Monitor records began in 2000. For extended periods from 2002 to 2005 and from 2012 to 2023, nearly the entire region was abnormally dry or even drier (see Figure 2).
  • Based on the long-term Palmer Index, drought conditions in the Southwest have varied since 1895. Since the early 1900s, the Southwest has experienced wetter conditions during three main periods: the 1900s, 1940s, and 1980s. Drier conditions occurred through the 1920s/1930s, again in the 1950s, and since 1990, when the Southwest has seen some of the most persistent droughts on record (see Figure 3).

Background

The American Southwest might evoke images of a hot, dry landscape—a land of rock, canyons, and deserts baked by the sun. Indeed, much of this region has low annual rainfall and seasonally high temperatures that contribute to its characteristic desert climate. Yet this landscape actually supports a vast array of plants and animals, along with millions of people who call the Southwest home. All of these plants, animals, and people need water to survive.

Water is already scarce in the Southwest, so every drop is a precious resource. People in the Southwest are particularly dependent on surface water supplies like Lake Mead, which are vulnerable to evaporation. Thus, even a small increase in temperature (which drives evaporation) or a decrease in precipitation in this already arid region can seriously threaten natural systems and society. Droughts also contribute to increased pest outbreaks and wildfires, both of which damage local economies, and they reduce the amount of water available for generating electricity—for example, at the Hoover Dam.1

While two other indicators present information about unusually high or low temperatures and drought on a national scale (see the High and Low Temperatures indicator and the Drought indicator), this feature highlights the Southwest because of its particular sensitivity to temperature and drought. Parts of the Southwest are also experiencing long-term reductions in mountain snowpack (see the Snowpack indicator), which accounts for a large portion of the region’s water supply. This feature focuses on six states that are commonly thought of as “southwestern” and characterized at least in part by arid landscapes and scarce water supplies: Arizona, California, Colorado, Nevada, New Mexico, and Utah. Temperature and drought data come from a network of thousands of weather stations overseen by the National Weather Service.

The map in Figure 1 shows how average annual temperatures in the Southwest from 2000 to 2023 differed from the average over the entire period since widespread temperature records became available (1895–2023).

Figures 2 and 3 show two ways of measuring drought in the Southwest: the Drought Monitor and the Palmer Drought Severity Index. The Palmer Index is calculated from precipitation and temperature measurements at weather stations, and has been used widely for many years. The Drought Monitor is a more recent and more detailed index based on several other indices (including Palmer), along with additional factors such as snow water content, groundwater levels, reservoir storage, pasture/range conditions, and other impacts. See the Drought indicator for more information about these indices.

For this and other examples of community connections to observed climate-related changes, see the StoryMap at: https://storymaps.arcgis.com/stories/ebd8dcbb0b6048cd81caa6eb450b8974.

About the Data

Notes

Natural variability, changes in irrigation practices, and other diversions of water for human use can influence certain drought-related measurements. Soil moisture, ground water, and streamflow are part of Drought Monitor calculations (Figure 2), and they are all sensitive to human activities.

Data Sources

Data for Figures 1 and 3 were obtained from the National Oceanic and Atmospheric Administration’s National Centers for Environmental Information, which maintains a large collection of climate data online at: https://www.ncei.noaa.gov/access/monitoring/climate-at-a-glance. Data for Figure 2 were provided by the National Drought Mitigation Center, which gives historical data in table form at: https://droughtmonitor.unl.edu/DmData/DataTables.aspx.

Technical Documentation

  • Download related technical information (pdf) (264 KB)

References

1 MacDonald, G. M. (2010). Water, climate change, and sustainability in the southwest. Proceedings of the National Academy of Sciences, 107(50), 21256–21262. https://doi.org/10.1073/pnas.0909651107

2 NOAA (National Oceanic and Atmospheric Administration). (2024). Climate at a glance. Retrieved December 3, 2024, from www.ncei.noaa.gov/access/monitoring/climate-at-a-glance

3 National Drought Mitigation Center. (2024). Data tables. Retrieved December 3, 2024, from https://droughtmonitor.unl.edu/DmData/DataTables.aspx


Learn about other indicators in this section

U.S. and Global Temperature
Seasonal Temperature
High and Low Temperatures
Heat Waves
U.S. and Global Precipitation
Heavy Precipitation
Tropical Cyclone Activity
River Flooding
Drought
Temperature and Drought in the Southwest

Climate Change Indicators

  • View the Indicators
    • Greenhouse Gases
      • U.S. Greenhouse Gas Emissions
      • Global Greenhouse Gas Emissions
      • Atmospheric Concentrations of Greenhouse Gases
      • Climate Forcing
    • Weather and Climate
      • U.S. and Global Temperature
      • Seasonal Temperature
      • High and Low Temperatures
      • Heat Waves
      • U.S. and Global Precipitation
      • Heavy Precipitation
      • Tropical Cyclone Activity
      • River Flooding
      • Drought
      • A Closer Look: Temperature and Drought in the Southwest
    • Oceans
      • Ocean Heat
      • Sea Surface Temperature
      • Marine Heat Waves
      • Sea Level
      • A Closer Look: Land Loss Along the Atlantic Coast
      • Coastal Flooding
      • Ocean Acidity
    • Snow and Ice
      • Arctic Sea Ice
      • Antarctic Sea Ice
      • Ice Sheets
      • Glaciers
      • Arctic Glaciers
      • A Closer Look: Glaciers in Glacier National Park
      • Lake Ice
      • Great Lakes Ice Cover
      • Community Connection: Ice Breakup in Three Alaskan Rivers
      • Snowfall
      • Snow Cover
      • Snowpack
      • Permafrost
      • Freeze-Thaw Conditions
    • Health and Society
      • Heat-Related Deaths
      • A Closer Look: Heat-Related Workplace Deaths
      • Heat-Related Illnesses
      • Cold-Related Deaths
      • Heating and Cooling Degree Days
      • Residential Energy Use
      • Lyme Disease
      • West Nile Virus
      • Length of Growing Season
      • Growing Degree Days
      • Ragweed Pollen Season
    • Ecosystems
      • Wildfires
      • Streamflow
      • Stream Temperature
      • Tribal Connection: Trends in Stream Temperature in the Snake River
      • Lake Temperature
      • Great Lakes Water Levels and Temperatures
      • Bird Wintering Ranges
      • A Closer Look: The Black Guillemots of Cooper Island
      • Marine Species Distribution
      • Leaf and Bloom Dates
      • Community Connection: Cherry Blossom Bloom Dates in Washington, D.C.
  • Dig into the Data
    • Map Explorer Basics
    • Southwest Case Study
  • Indicator Stories
    • Indicator Infographics
    • Community Connections
    • Indicators Overview StoryMap
    • Seasonality and Climate Change
  • About the Indicators
    • Data Sources and Methods
    • Frequent Questions about the Indicators
    • Publications
Contact Us About Climate Indicators
Contact Us to ask a question, provide feedback, or report a problem.
Last updated on May 9, 2025
  • Assistance
  • Spanish
  • Arabic
  • Chinese (simplified)
  • Chinese (traditional)
  • French
  • Haitian Creole
  • Korean
  • Portuguese
  • Russian
  • Tagalog
  • Vietnamese
United States Environmental Protection Agency

Discover.

  • Accessibility Statement
  • Budget & Performance
  • Contracting
  • EPA www Web Snapshot
  • Grants
  • No FEAR Act Data
  • Plain Writing
  • Privacy
  • Privacy and Security Notice

Connect.

  • Data
  • Inspector General
  • Jobs
  • Newsroom
  • Regulations.gov
  • Subscribe
  • USA.gov
  • White House

Ask.

  • Contact EPA
  • EPA Disclaimers
  • Hotlines
  • FOIA Requests
  • Frequent Questions
  • Site Feedback

Follow.