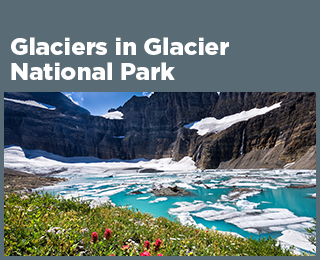
A Closer Look: Glaciers in Glacier National Park
This regional feature examines how the surface area of glaciers in Glacier National Park in Montana has changed since 1966.
Figure 1. Total Glacier Surface Area in Glacier National Park, 1966–2015 
Figure 2. Change in Glacier Surface Area in Glacier National Park, 1966–2015 
This map illustrates the change in surface area of all 37 named glaciers in Glacier National Park for 1966, 1998, 2005, and 2015. Use the red map icon above to open an interactive version where users can view the individual data layers, pan the map, and zoom to see more detail.
Data source: Fagre et al., 2017;3 USGS, 20174
Web update: April 2021
Key Points
- The total surface area of the 37 named glaciers in Glacier National Park decreased by about 34 percent between 1966 and 2015 (see Figure 1).
- Every glacier’s surface area was smaller in 2015 than it was in 1966 (see Figure 2). Three glaciers temporarily gained some area during part of the overall time period.
- The overall trend of shrinking surface area of glaciers in Glacier National Park is consistent with the retreat of glaciers observed in the United States and worldwide (see the Glaciers indicator).
Background
Visitors from far and wide are drawn to Glacier National Park in Montana for its dramatic beauty and its glaciers. Established in 1910, Glacier is one of the most visited national parks in the United States. Warming temperatures and other changes are melting the park’s alpine glaciers. Such changes have implications not only for tourism, but also for the ecosystems, animals, and people that depend on glacier-fed streamflow. Shrinking glaciers represent a clear and compelling indicator of climate change.
In 2017, the U.S. Geological Survey (USGS) published a study where they analyzed aerial images from 1966, 1998, 2005, and 2015 to assess changes over time in the surface area of Glacier National Park’s 37 named glaciers. Scientists are studying the Park’s alpine glaciers to better understand how they have changed, what that means for the local environment, and how they may inform land management decisions in the park.
About the Data
Notes
Surface area changes of these glaciers do not reflect how the total mass or volume of ice may have changed. Changes in glacier surface area will not necessarily track linearly with changes in temperature because of differences in geology, shade, wind patterns that deposit snow, and other factors. The 37 glaciers included in this data set include all of Glacier National Park’s large named glaciers, but they do not represent a comprehensive accounting of all glaciers or permanent ice features in the park. These glaciers are also not necessarily representative of glaciers in other regions. In the past few decades, though, several national parks have begun to track glacier mass balance. All of these programs depend on data sets, expertise, and methodologies developed by the intensive research associated with USGS’s long-term glacier monitoring program.
Data Sources
The data in this feature come from surface area measurements of the 37 named glaciers in Glacier National Park that have been tracked over time. This data set was originally published by USGS’s Northern Rocky Mountain Science Center. This data set is also publicly available on the USGS website at: https://www.usgs.gov/media/files/table-area-named-glaciers-national-park-and-forest.
Technical Documentation
References
1 Fagre, D.B., L.A. McKeon, K.A. Dick, and A.G. Fountain. 2017. Glacier margin time series (1966, 1998, 2005, 2015) of the named glaciers of Glacier National Park, MT, USA. U.S. Geological Survey data release. https://doi.org/10.5066/F7P26WB1.
2 USGS (U.S. Geological Survey). 2017. Area of the named glaciers of Glacier National Park (GNP) and Flathead National Forest (FNF) derived from aerial and satellite imagery, 1966, 1998, 2005, 2015. https://www.usgs.gov/media/files/table-area-named-glaciers-national-park-and-forest.
3 Fagre, D.B., L.A. McKeon, K.A. Dick, and A.G. Fountain. 2017. Glacier margin time series (1966, 1998, 2005, 2015) of the named glaciers of Glacier National Park, MT, USA. U.S. Geological Survey data release. https://doi.org/10.5066/F7P26WB1.
4 USGS (U.S. Geological Survey). 2017. Area of the named glaciers of Glacier National Park (GNP) and Flathead National Forest (FNF) derived from aerial and satellite imagery, 1966, 1998, 2005, 2015. https://www.usgs.gov/media/files/table-area-named-glaciers-national-park-and-forest.
Learn about other indicators in this section