Climate Change Indicators: Growing Degree Days
This indicator shows changes in growing degree days, which can signal changes in the timing and length of pollen seasons in the United States.
Figure 1. Change in Growing Degree Days in the Contiguous 48 States, 1948–2023
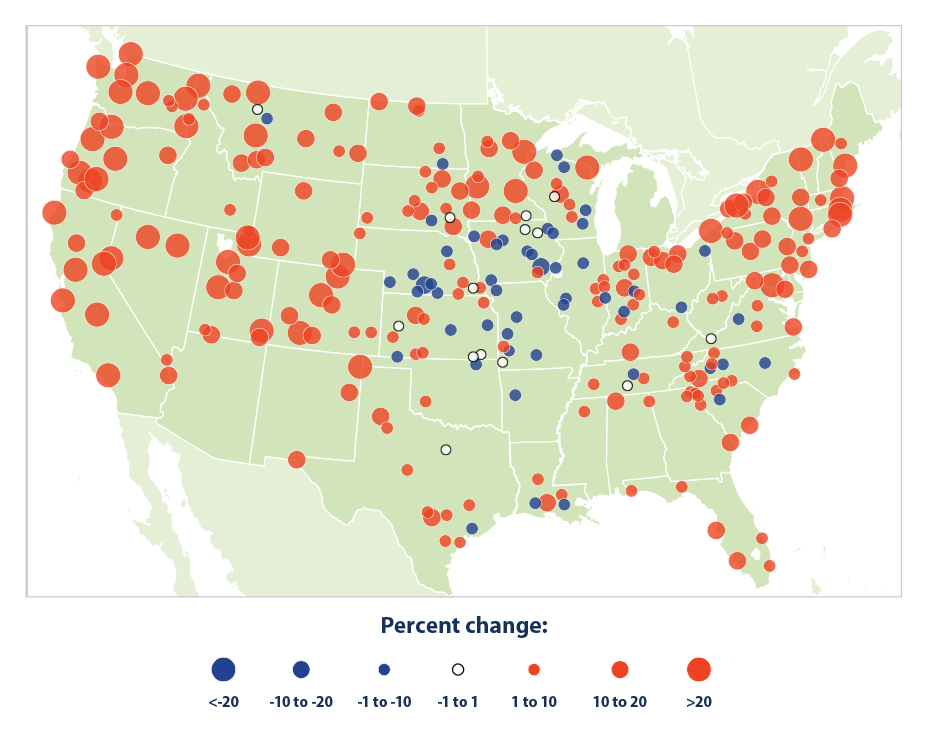
This map shows trends in the total number of growing degree days per year at 280 weather stations. The color and size of the symbols represent percent change between 1948 and 2023, based on the long-term average rate of change.
Data source: NOAA, 20248
Web update: June 2024
Key Points
- Between 1948 and 2023, the number of growing degree days increased at 221 of the 280 long-term stations measured (79 percent) across the contiguous 48 states (see Figure 1). The average change across all stations represents an increase of about 10 percent.
- The largest increases in growing degree days from 1948 to 2023 occurred in the West and the Northeast (see Figure 1). Fifty stations, mostly in the West, have experienced an increase of 20 percent or more.
- Because growing degree days are correlated with a longer grass pollen season and an earlier start date for oak and birch pollen seasons,7 the increased number of growing degree days suggests that the length of grass, oak, and birch pollen season grew between 1948 and 2023 in many parts of the contiguous United States.
Background
Increasing concentrations of atmospheric carbon dioxide and changes in climate—such as increasing temperatures and altered precipitation patterns—are expected to contribute to increases in levels and distribution of plant pollen.1 Pollen from trees and grasses is a common allergen that can trigger health effects such as allergic rhinitis (“hay fever”) and asthma. In the United States in 2021, 26 percent of adults reported having at least one seasonal allergy.2 About 8 percent of adults and 6.5 percent of children also reported suffering from asthma, and this population of asthmatics accounts for about 1 million emergency department visits yearly.3 These health effects lead to economic costs from medical expenses and missed work and school days. Asthma caused an estimated $50 billion in medical expenses and $3 billion in the value of lost work and school days in 2013.4 Direct medical spending to treat hay fever was estimated at $3.4 billion in 2011.5
The timing of pollen seasons is linked to climate trends and variations, including changes in growing degree days—a widely used measure for tracking plant growth and development. As with the Length of Growing Season indicator, growing degree days are based on temperature, because plants typically only grow when the temperature is above a certain minimum. Studies have shown that as growing degree days increase, grass pollen season grows longer and oak and birch pollen seasons begin earlier.7 Earlier pollen season start dates are associated with a longer pollen season overall.7 More broadly, growing degree days also affect plant growth, agricultural production, and the spread and impact of plant diseases and pests.
About the Indicator
Growing degree days are calculated using daily temperature data from weather stations. As with the Heating and Cooling Degree Days indicator, growing degree days are based on the number of degrees above a certain minimum temperature. Different plants have different temperature requirements, so EPA chose a baseline temperature of 50°F, which is commonly used for analysis when there are multiple plant species of interest. Using this baseline, a day with an average temperature of 70°F represents 20 growing degree days.
This indicator examines changes in the number of growing degree days from 1948 to 2023 at locations across the United States. This indicator includes 280 weather stations operated by the National Oceanic and Atmospheric Administration because they had sufficient data completeness during the entire period of record. For each station, daily growing degrees were calculated by taking the average of the daily maximum and minimum temperatures, then subtracting 50°F. Daily results were added together to calculate total annual growing degree days for each year from 1948 to 2023. Figure 1 shows how the total number of growing degree days per year has changed over time at each location.
About the Data
Indicator Notes
Growing degree days reflect cumulative conditions that support plant development, but they do not capture potentially important factors related to the sequence of weather conditions, which can also have considerable effects on plant development. Factors other than growing degree days also affect pollen season duration and start date. Some of those factors relate to plant growth patterns, and some—such as local plant composition, geographic location (latitude), and proximity to urban areas—are not directly related to climate. As a result, the exact link between growing degree days and pollen season timing is not precise and may vary over time and at different locations. Also, a change in total growing degree days does not necessarily change the intensity of the pollen season. Nonetheless, because allergies are a major public health concern, observed changes in growing degree days, which serve as a proxy for changes in pollen season length and start date, provide insight into ways in which climate change may affect human well-being.
Data Sources
Temperature data for this indicator come from the Global Historical Climatology Network, maintained by the National Oceanic and Atmospheric Administration. The analysis draws on prior research by Zhang et al. (2015) on the relationship between growing degree days and pollen.6
Technical Documentation
References
1 Fann, N., Brennan, T., Dolwick, P., Gamble, J. L., Ilacqua, V., Kolb, L., Nolte, C. G., Spero, T. L., & Ziska, L. (2016). Chapter 3: Air quality impacts. In USGCRP (U.S. Global Change Research Program), The impacts of climate change on human health in the United States: A scientific assessment (pp. 69–98). https://doi.org/10.7930/J0GQ6Vp6
2 Ng, A. E., & Boersma, P. (2023). Diagnosed allergic conditions in adults: United States, 2021 (NCHS Data Brief No. 460). CDC (U.S. Centers for Disease Control and Prevention). www.cdc.gov/nchs/products/databriefs/db460.htm
3 CDC (U.S. Centers for Disease Control and Prevention). (2023). Most recent national asthma data. Retrieved May 11, 2024, from www.cdc.gov/asthma/most_recent_national_asthma_data.htm
4 Nurmagambetov, T., Kuwahara, R., & Garbe, P. (2018). The economic burden of asthma in the United States, 2008–2013. Annals of the American Thoracic Society, 15(3), 348–356. https://doi.org/10.1513/AnnalsATS.201703-259OC
5 Meltzer, E. O., & Bukstein, D. A. (2011). The economic impact of allergic rhinitis and current guidelines for treatment. Annals of Allergy, Asthma & Immunology, 106(2), S12–S16. https://doi.org/10.1016/j.anai.2010.10.014
6 Zhang, Y., Bielory, L., Cai, T., Mi, Z., & Georgopoulos, P. (2015). Predicting onset and duration of airborne allergenic pollen season in the United States. Atmospheric Environment, 103, 297–306. https://doi.org/10.1016/j.atmosenv.2014.12.019
7 Lo, F., Bitz, C. M., Battisti, D. S., & Hess, J. J. (2019). Pollen calendars and maps of allergenic pollen in North America. Aerobiologia, 35(4), 613–633. https://doi.org/10.1007/s10453-019-09601-2
8 NOAA (National Oceanic and Atmospheric Administration). (2024). Global Historical Climatology Network daily (GHCNd). Retrieved April 1, 2024, from www.ncei.noaa.gov/products/land-based-station/global-historical-climatology-network-daily
Learn about other indicators in this section