
Climate Change Indicators in the United States
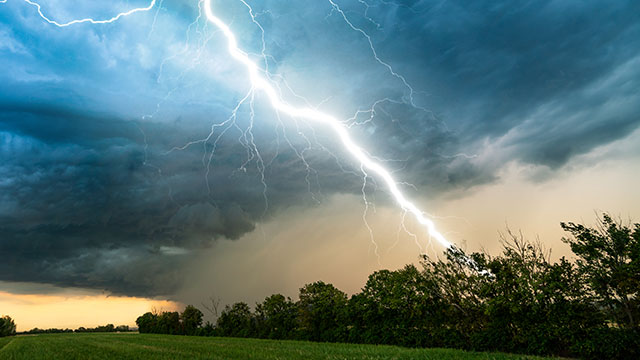
Temperatures are rising, snow and rainfall patterns are shifting, and more extreme climate events – like heavy rainstorms and record high temperatures – are becoming more common. Many of these observed climate changes are linked to rising levels of greenhouse gases in our atmosphere, caused by human activities. EPA’s indicators provide evidence of these changes and their impacts on people and the environment. EPA partners with dozens of data contributors to compile and keep these indicators up to date.
| Visit Climate Change Indicators in the United States: Fifth Edition for a report that uses these indicators to show interconnections in how climate change affects people and the environment, why the impacts matter, and examples of how people and communities are addressing these challenges. |
-
View the Indicators
Check out more than 50 indicators that show the causes and effects of climate change.
-
Dig into the Data

Explore the data with maps and figures.
-
Indicator Stories
Follow along with detailed narratives and supporting data about specific effects of climate change.
-
About the Indicators
Learn about how EPA develops indicators, find answers to frequent questions, and access publications.
-
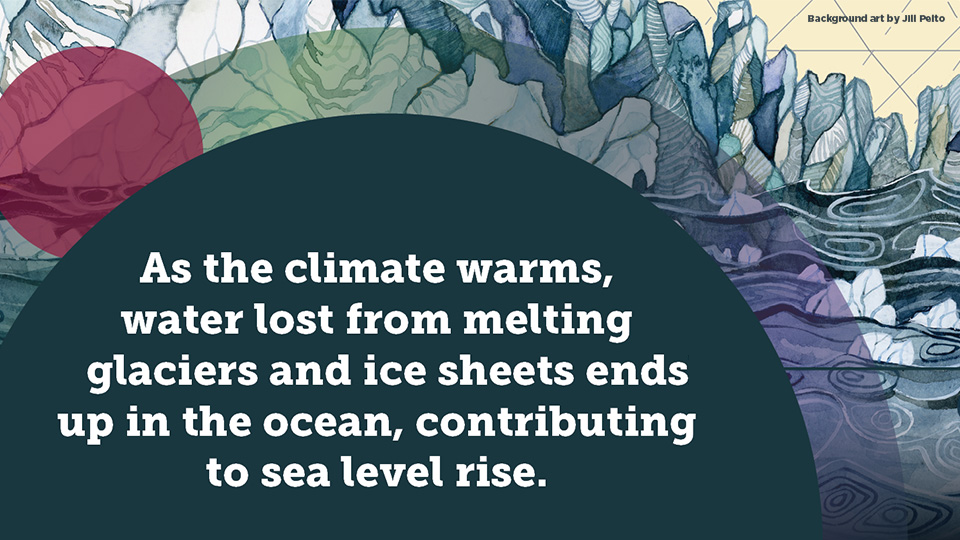
Shrinking glaciers and rising seas.
As Earth's temperatures rise, so do sea levels. Water lost from melting glaciers and ice sheets ends up in the oceans, directly contributing to rising sea levels. Warmer ocean temperatures also cause the water itself to expand. EPA’s Fifth Edition report compiles decades of data, highlighting the impacts of these changes on water supplies, ecosystems, and coastal communities. -

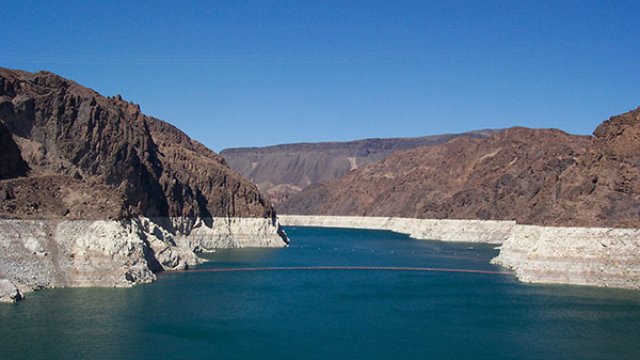
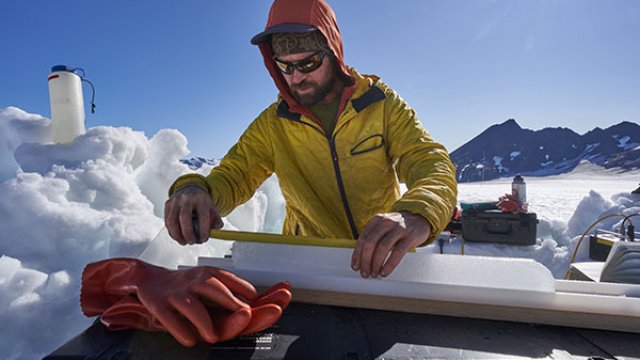
Glaciers losing ice.
A warmer climate has caused glaciers in the United States and around the world to shrink as they lose ice more quickly than they can accumulate new snowfall. If glaciers disappear, this will pose a challenge for the communities and ecosystems that rely on them for streamflow and drinking water. See 70 years of data in the Glaciers indicator. -
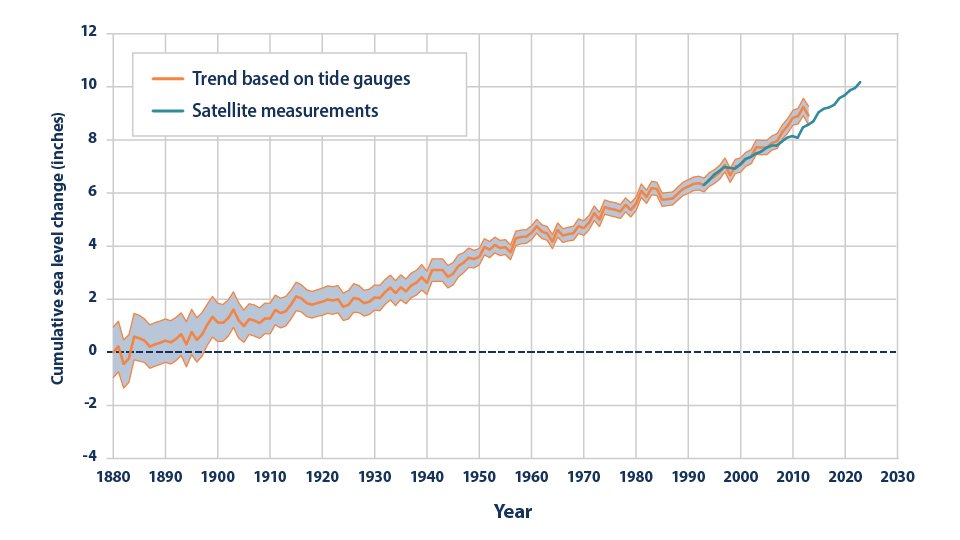
Rising seas.
In recent years, the ocean surface around the world has been rising by about an inch per decade. This is twice as fast as sea level rise during the last century. This rapid increase is closely tied to rising temperatures. Meltwater from glaciers and ice sheets flows into the ocean, while warmer ocean water expands, taking up more space. Together, these factors are driving sea level rise, which contributes to land loss, coastal flooding, and other risks. Dive into data from tide gauges and satellites with the Sea Level indicator. -
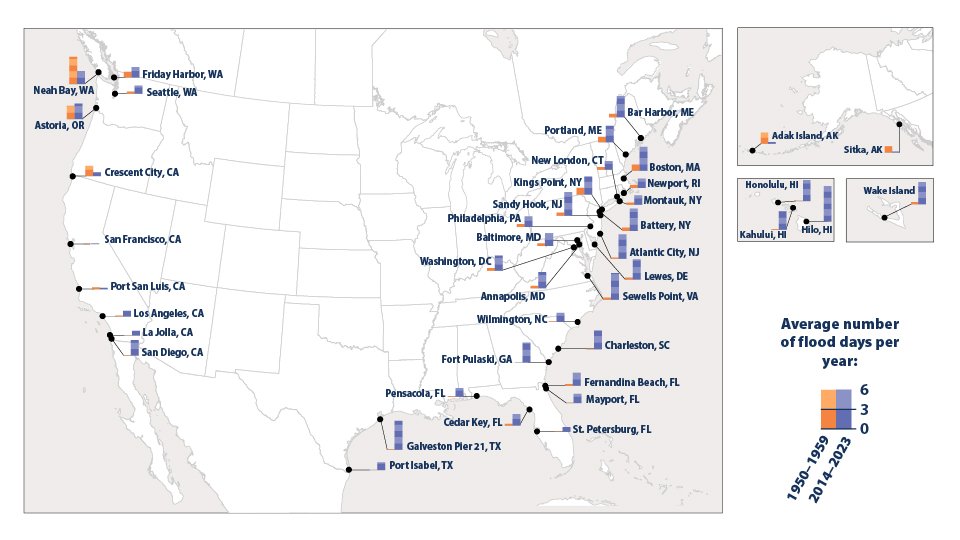
Coastal communities are flooding more frequently.
As warmer temperatures cause sea level to rise, areas along U.S. coasts are flooding more often. In recent years, coastal communities have experienced more days of “nuisance” flooding at high tide, even on sunny days with no storm surge. Explore more than 60 years of flooding data at 42 sites along U.S coasts.