Climate Change Indicators: Seasonal Temperature
This indicator describes trends in average temperatures for each season across the United States.
Figure 2. Change in Seasonal Temperatures by State, 1896–2023
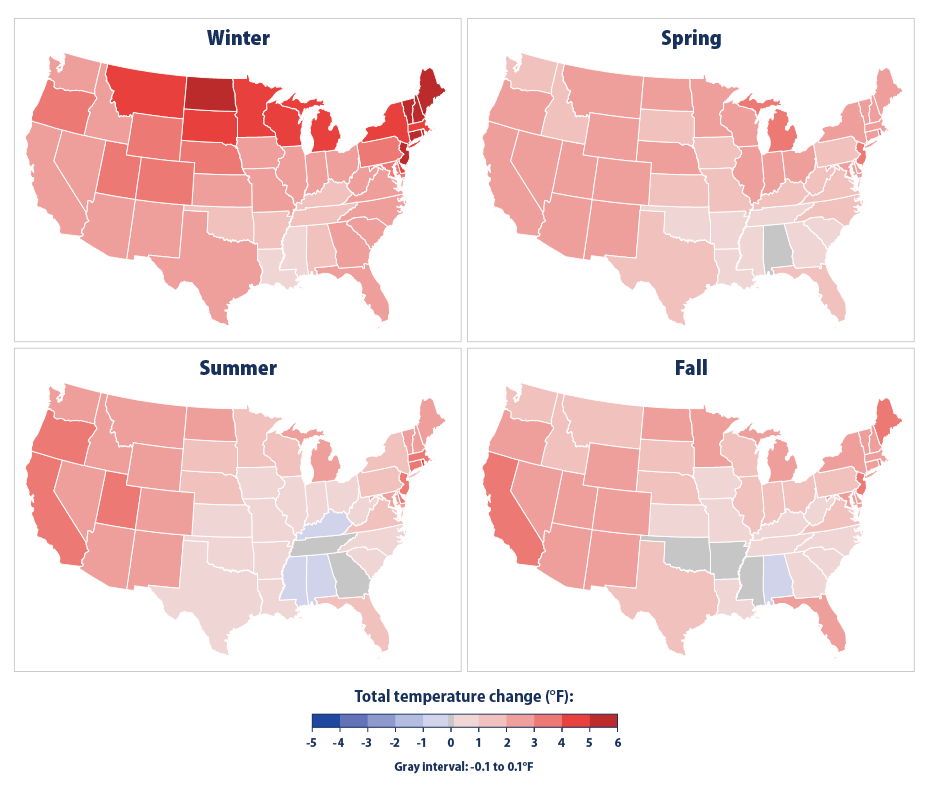
These maps show the total change in the average seasonal temperature for each of the contiguous 48 states from 1896 to 2023, in degrees Fahrenheit. Total change in temperature was calculated from the long-term average rate of change. Seasons are defined as follows: December, January, and February for winter; March, April, and May for spring; June, July, and August for summer; and September, October, and November for fall.
Data source: NOAA, 20244
Web update: June 2024
Key Points
- Since 1896, average winter temperatures across the contiguous 48 states have increased by about 3°F (see Figures 1 and 3). Spring temperatures have increased by about 2°F, while summer and fall temperatures have increased by about 1.6°F.
- A trend toward warmer winters is consistent with observed reductions in snow (see the Snowfall, Snow Cover, and Snowpack indicators) and shorter ice seasons (see the Lake Ice indicator). Warmer winter, spring, and fall temperatures are also consistent with longer growing seasons (see the Length of Growing Season indicator). Warmer average summer temperatures align with the observation that extremely hot temperatures have become more frequent since the mid-20th century (see the Heat Waves indicator).
- Temperature changes vary by state, with larger seasonal increases across the northern states and the Mountain West, and smaller increases in the South and Southeast (see Figure 2). All 48 states experienced winter warming over this time period. Most states experienced warming in the spring, summer, and fall, but a few states had little to no overall change or cooled slightly (for example, Alabama) during those months.
Background
As the Earth warms overall, average temperatures increase throughout the year (see the U.S. and Global Temperature indicator), but the increases may be larger in certain seasons than in others.
The winter is particularly vulnerable to rising temperatures. Overall, minimum temperatures have increased at a higher rate than average maximum temperatures.1 Much of the observed warming in the United States has taken place when and where it is usually the coldest—namely, during winter,1 at night, and in the northern parts of the country. Although the United States has experienced many winters with unusually low temperatures, unusually cold winter temperatures have become less common—particularly very cold nights (lows)1 (see also the High and Low Temperatures indicator). Changing winter temperatures directly influence the amount of snow that falls and accumulates, amount of seasonal snowpack, timing of snowmelt runoff, loss of soil moisture through evapotranspiration, and amount of time that lakes are frozen (see the Snowfall, Snowpack, and Lake Ice indicators). These changes are reducing water supplies—particularly in western states that depend heavily on snowpack—and threatening winter recreation and tourism, an industry worth $12 to 20 billion a year in the United States.2,3
Warming in other seasons can also affect daily life in various ways. For example, warmer spring and fall temperatures extend the growing season (see the Length of Growing Season indicator), which can benefit some forms of agriculture but also lead to a longer and more intense pollen season for allergy sufferers (see the Ragweed Pollen Season indicator). These changes could also extend the wildfire season. A warmer summer likely means more money spent on air conditioning, while a warmer winter could mean less money spent on home heating (see the Heating and Cooling Degree Days indicator). Seasonal warming could also disrupt the timing of events that are important for plants and animals, such as budding, flower blooms, hibernation, egg-laying, hatching, and migration.
About the Indicator
This indicator examines changes in average temperatures in each season, defined here by calendar month (for example, winter is December, January, and February). The indicator is based on daily temperature measurements from more than 10,000 weather stations located across the contiguous 48 states.
Starting in 1896, this indicator shows annual anomalies, or differences, compared with the long-term average seasonal temperatures from 1901 to 2000 (Figure 1). For example, an anomaly of +2.0°F in a winter means the average winter temperature was 2 degrees higher than the long-term average. Anomalies have been calculated for each weather station. Daily temperature measurements at each site were used to calculate monthly anomalies, which were then averaged for each season to find temperature anomalies for each year. Average anomalies are calculated for areas within each state based on station density and proximity, as well as the topography of the area. These sub-state-level anomalies are then averaged together in proportion to their area to develop state and national results.
About the Data
Indicator Notes
Data from the early part of the time period are somewhat less precise than more recent data because there were fewer stations collecting measurements at the time. The overall trends are still reliable, however. Where possible, the data have been adjusted to account for any biases that might be introduced by factors such as station moves, urbanization near the station, changes in measuring instruments, and changes in the exact times at which measurements are taken.
Alaska, Hawai'i, and U.S. territories are not included, due to limitations in available data.
Data Sources
The data for this indicator were provided by the National Oceanic and Atmospheric Administration’s National Centers for Environmental Information, which maintains a large collection of climate data online at: www.ncei.noaa.gov.
Technical Documentation
References
1 Marvel, K., Su, W., Delgado, R., Aarons, S., Chatterjee, A., Garcia, M. E., Hausfather, Z., Hayhoe, K., Hence, D. A., Jewett, E. B., Robel, A., Singh, D., Tripati, A., & Vose, R. S. (2023). Chapter 2: Climate trends. In USGCRP (U.S. Global Change Research Program), Fifth National Climate Assessment. https://doi.org/10.7930/NCA5.2023.CH2
2 Hagenstad, M., Burakowski, E., & Hill, R. (2018). The economic contributions of winter sports in a changing climate. Protect Our Winters and REI Co-op. https://protectourwinters.org/wp-content/uploads/2019/12/POW-2018-economic-report.pdf
3 Wobus, C., Small, E. E., Hosterman, H., Mills, D., Stein, J., Rissing, M., Jones, R., Duckworth, M., Hall, R., Kolian, M., Creason, J., & Martinich, J. (2017). Projected climate change impacts on skiing and snowmobiling: A case study of the United States. Global Environmental Change, 45, 1–14. https://doi.org/10.1016/j.gloenvcha.2017.04.006
4 NOAA (National Oceanic and Atmospheric Administration). (2024). National Centers for Environmental Information. Retrieved February 1, 2024, from www.ncei.noaa.gov
Learn about other indicators in this section