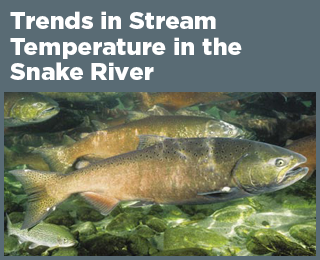
Tribal Connection: Trends in Stream Temperature in the Snake River
This feature tracks the summer water temperature of the Snake River.
Figure 1. Average August Temperature in the Snake River, 1960–2022 
This graph shows average August water temperatures at a site along the Snake River in eastern Washington.
Data source: USGS, 20237
Web update: September 2023
Climate change has challenged and will continue to challenge some of the traditional ways of life that have sustained indigenous peoples for thousands of years. In the Pacific Northwest, warming river and stream temperatures will threaten ecosystems and species, including salmon populations.1 Salmon play a particularly important role in the diet, culture, religion, and economy of Native Americans in this region.2
Salmon are sensitive to water temperature at many stages of their lives. They spend much of their adult lives in the ocean, then migrate inland to spawn. Salmon need cold water to migrate and for their young to hatch and grow successfully. Warmer water can negatively affect fish, making it more difficult for them to swim upstream. It can also make fish more susceptible to disease.3 River and stream temperatures in the Pacific Northwest are influenced by many factors, but are expected to rise as average air temperatures increase (see the U.S. and Global Temperature indicator).4,5,6
The graph shows average August water temperatures at a site in the Snake River, in eastern Washington near Nez Perce tribal lands. Several species of salmon use the Snake River to migrate and spawn. Between 1960 and 2022, water temperature has increased by 2.2°F.
For this and other examples of community connections to observed climate-related changes, see EPA’s StoryMap.
Technical Documentation
References
1. USGCRP (U.S. Global Change Research Program). 2018. Impacts, risks, and adaptation in the United States: Fourth National Climate Assessment, volume II. Reidmiller, D.R., C.W. Avery, D.R. Easterling, K.E. Kunkel, K.L.M. Lewis, T.K. Maycock, and B.C. Stewart, eds. https://repository.library.noaa.gov/view/noaa/19487. doi:10.7930/NCA4.2018.
2. Dittmer, K. 2013. Changing streamflow on Columbia basin tribal lands—Climate change and salmon. Climatic Change 120(3):627–641.
3. U.S. EPA (U.S. Environmental Protection Agency). 2001. Issue paper 5: Summary of technical literature examining the physiological effects of temperature on salmonids. EPA-910-D-01-005.
4. Caissie, D. 2006. The thermal regime of rivers: A review. Freshwater Biol. 51:1389–1406.
5. Van Vliet, M.T.H., F. Ludwig, and P. Kabat. 2013. Global streamflow and thermal habitats of freshwater fishes under climate change. Climatic Change 121:739–754.
6. Isaak, D.J., S. Wollrab, D. Horan, and G. Chandler. 2012. Climate change effects on stream and river temperatures across the Northwest U.S. from 1980–2009 and implications for salmonid fishes. Climatic Change 113:499–524.
7. USGS (U.S. Geological Survey). 2023. Analysis of data from the National Water Information System. Accessed February 2023.
Learn about other indicators in this section