Climate Change Indicators: West Nile Virus
This indicator tracks the rate of reported West Nile neuroinvasive disease cases across the United States.
Figure 2. Reported West Nile Neuroinvasive Disease Cases by State, 2002–2023
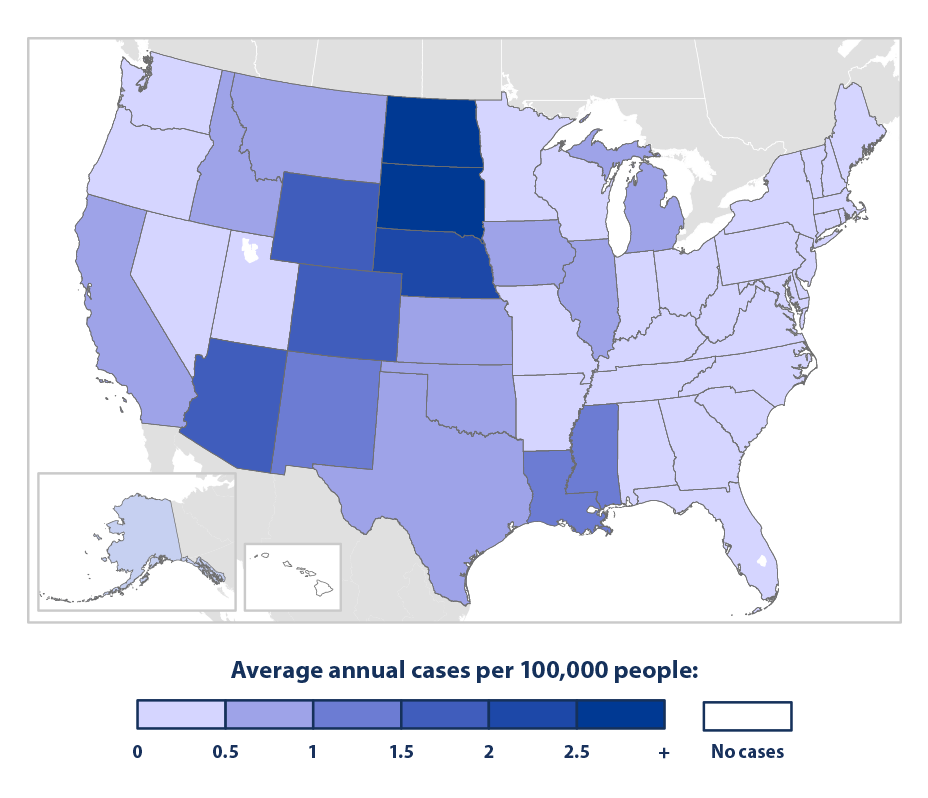
This map shows the average annual incidence of West Nile neuroinvasive disease in each state, which is calculated as the average number of new cases per 100,000 people per year from 2002 to 2023. The map is based on cases that local and state health departments report to CDC’s national disease tracking system. Neuroinvasive cases, which account for less than 1 percent of people infected with West Nile virus, are those that affect the brain or cause neurologic dysfunction.
Data source: CDC, 20243
Web update: December 2024
Key Points
- The incidence of West Nile neuroinvasive disease in the United States has varied widely from year to year (see Figure 1). No obvious long-term trend can be detected yet through this limited data set.
- The years 2002, 2003, and 2012 had the highest reported incidence rates, around one case per 100,000 people (see Figure 1).
- West Nile virus occurs throughout the contiguous 48 states. Based on reported neuroinvasive cases, average annual incidence is highest in parts of the Southwest, the Mississippi Delta region, the Great Plains, and the Rocky Mountain region (see Figure 2).
Background
Climate change is expected to affect the geographic and seasonal patterns of vector-borne diseases (that is, diseases caused by pathogens transmitted by mosquitoes, ticks, fleas, or other arthropods) in the United States.1 West Nile virus was first detected in the United States in 1999 and is now the most common cause of mosquito-borne disease in the United States in most years. While many infected people feel no symptoms, others can experience symptoms such as headache, body aches, joint pains, vomiting, diarrhea, and rash, as well as more severe damage to the central nervous system in some patients, causing encephalitis, meningitis, and occasionally death.2 From 1999 to 2023, a total of 59,141 cases of West Nile virus disease were reported to the U.S. Centers for Disease Control and Prevention (CDC). More than half of the reported cases of people infected with West Nile virus were neuroinvasive—that is, affecting the brain or causing neurologic dysfunction.3 Mosquitoes acquire the virus by biting infected birds, which are the main hosts of the virus. People are then infected when they are bitten by these virus-carrying mosquitoes.
Climate change increases the risk of human exposure to West Nile virus. Studies show that warmer temperatures associated with climate change can accelerate mosquito development, biting rates, and the incubation of the disease within a mosquito.1 The effect of climate change on the timing of bird migration and breeding patterns may also contribute to changes in long-range virus movement. Mild winters and drought have been associated with West Nile virus disease outbreaks,1,4 while rainfall can also contribute by creating breeding sites for mosquitoes.1
Climate is just one of many important factors that influence the transmission, distribution, and incidence of West Nile virus disease. Human exposure to infected mosquitoes is also influenced by multiple factors, including changes in the proximity of human populations to mosquitoes and host bird species, increased awareness of West Nile virus, and modified behaviors, such as spending less time outdoors during peak mosquito-biting times and taking precautions to avoid being bitten. West Nile disease is one of many diseases transmitted to humans by mosquitoes that CDC tracks.5
About the Indicator
This indicator looks at the incidence of human cases of West Nile virus neuroinvasive disease, which reflects the rate of new cases contracted in a given geographic area and time period. Incidence is typically calculated as the number of cases per 100,000 people per year. This indicator focuses on neuroinvasive cases because the symptoms are noticeable and typically require medical care. The indicator summarizes surveillance data reported to the CDC. West Nile is a nationally notifiable disease, which means health care providers are required to report confirmed cases to their local or state health departments. CDC compiles these reported data and calculates national totals and rates. Figure 1 shows national incidence by year since 2002, when West Nile virus first became notifiable. Figure 2 shows the incidence for each state, averaged over the period from 2002 to 2023.
About the Data
Indicator Notes
This indicator depends on clinicians making the correct diagnosis and reporting laboratory-confirmed cases to public health authorities. Changes in diagnosing practices, awareness of the virus, and mosquito control efforts over time can affect trends. Cases are reported based on the patient’s state of residence, which is not necessarily the place where they were infected. Non-neuroinvasive cases of West Nile virus disease have been tracked since 2005, but because the symptoms may be mild or undetected they are significantly underreported.6 Thus, this indicator only focuses on neuroinvasive cases.
Because of the many factors affecting mosquito populations and reporting of West Nile virus disease and the fact that data have only been collected for a little more than a decade, this indicator does not provide sufficient information to determine what proportion of the observed changes in incidence is directly driven by climate change. Further study is critical to improving the usefulness of this indicator and informing decisions affecting public health. For information on prevention, symptoms, and treatment of West Nile virus disease, see: www.cdc.gov/west-nile-virus.
Data Sources
This indicator is based on publicly available West Nile virus disease data compiled by CDC at: www.cdc.gov/west-nile-virus/data-maps/historic-data.html.
Technical Documentation
References
1 Beard, C. B., Eisen, R. J., Barker, C. M., Garofalo, J. F., Hahn, M., Hayden, M., Monaghan, A. J., Ogden, N. H., & Schramm, P. J. (2016). Chapter 5: Vectorborne diseases. In The impacts of climate change on human health in the United States: A scientific assessment. U.S. Global Change Research Program.
2 CDC (U.S. Centers for Disease Control and Prevention). (2024). West Nile: Symptoms, diagnosis, & treatment. Retrieved December 12, 2024, from www.cdc.gov/west-nile-virus/symptoms-diagnosis-treatment
3 CDC (U.S. Centers for Disease Control and Prevention). (2024). West Nile virus: Historic data (1999–2023). Retrieved December 12, 2024, from www.cdc.gov/west-nile-virus/data-maps/historic-data.html
4 Hahn, M. B., Monaghan, A. J., Hayden, M. H., Eisen, R. J., Delorey, M. J., Lindsey, N. P., Nasci, R. S., & Fischer, M. (2015). Meteorological conditions associated with increased incidence of West Nile virus disease in the United States, 2004–2012. American Journal of Tropical Medicine and Hygiene, 92(5), 1013–1022. https://doi.org/10.4269/ajtmh.14-0737
5 Rosenberg, R., Lindsey, N., Fischer, M., Gregory, C., Hinckley, A., Mead, P., Paz-Bailey, G., Waterman, S., Drexler, N., Kersh, G., Hooks, H., Partridge, S., Visser, S., Beard, C., & Petersen, L. (2018). Vital signs: Trends in reported vectorborne disease cases—United States and territories, 2004–2016. Morbidity and Mortality Weekly Report, 67(17), 496–501. https://doi.org/10.15585/mmwr.mm6717e1
6 CDC (U.S. Centers for Disease Control and Prevention). (2024). Guidelines for West Nile virus surveillance and control. Retrieved December 12, 2024, from www.cdc.gov/west-nile-virus/php/surveillance-and-control-guidelines
Learn about other indicators in this section