Climate Change Indicators: Lake Temperature
This indicator shows changes in surface water temperatures in North American lakes.
Key Points
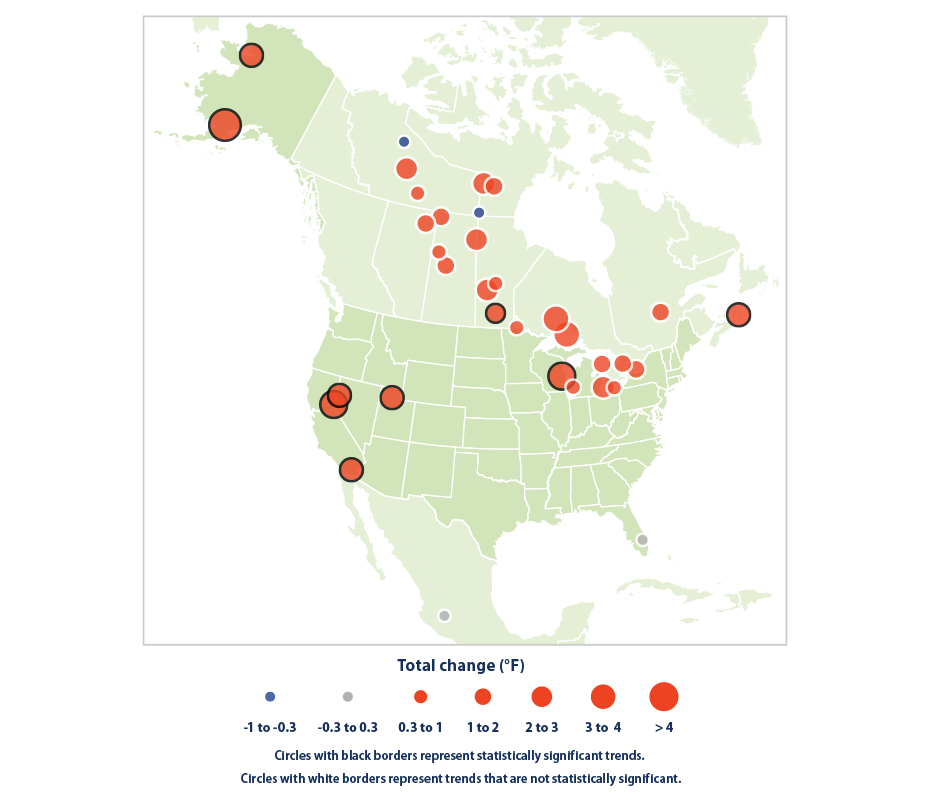
- Since 1985, summer surface water temperatures have increased in 32 of the 34 lakes studied. A total of 24 lakes warmed by more than 1°F, and 15 by more than 2°F. Warming was statistically significant in nine of these lakes (see Figure 1).
- Iliamna Lake in Alaska warmed the most between 1985 and 2009—more than 4°F (see Figure 1). Other lakes with sizable increases can be found in various parts of the United States and Canada. The two southernmost lakes in Figure 1, Okeechobee in Florida and Chapala in Mexico, had the smallest changes in temperature.
- Increases in summer water temperature throughout North America over the last three decades are consistent with other studies, such as a detailed analysis of the entire surface of each of the Great Lakes (see the Great Lakes Water Levels and Temperatures indicator).
Background
Water temperature is an important physical property of every lake. Many plants, animals, and other organisms flourish only in a specific range of water temperatures. Temperature can also affect certain aspects of water quality. For example, higher temperatures promote the growth of algae and bacteria, but they also reduce levels of dissolved oxygen in the water, which can negatively affect the growth and productivity of other aquatic life. Water temperature also influences the circulation or mixing patterns within a lake, which affects nutrient levels.
Temperature influences how people are able to use lakes. For example, while warmer water might be more inviting for recreation, it also contributes to blooms of harmful algae and bacteria that produce toxins. These toxins can cause illnesses in recreational users and contaminate drinking water supplies. Warmer water lengthens the season when lakes are ice-free (see the Lake Ice indicator). This can benefit boaters and shippers but also increases evaporation, lowering water levels (see the Great Lakes Water Levels and Temperatures indicator). Less lake ice reduces opportunities for winter recreation, such as ice fishing and hockey.
Water temperature is influenced by many factors, but most directly by air temperature. As rising air temperatures (see the U.S. and Global Temperature indicator) cause lake temperatures to rise, the geographic ranges and growth seasons of certain harmful algae and bacteria are expected to expand.1 Rising water temperatures are also expected to expand the ranges of and give new advantages to certain invasive species, such as the zebra mussel.2
About the Indicator
This indicator looks at the average summer water temperatures of 34 lakes in the United States, Canada, and Mexico, based on satellite measurements that detect the temperature of the water at the surface (approximately 1 meter or 3 feet in depth). Because water temperature can also be influenced by wastewater discharges and other human activities, this indicator focuses on a select set of lakes that are relatively large, natural bodies of water (all more than 150 square miles) where consistent data dating back to 1985 were available. Furthermore, each lake’s measurements were taken in a single location near the center of the lake to minimize influences such as shoreline development and other land use activities. Figure 1 shows long-term rates of change in surface lake water temperature from 1985 to 2009.
About the Data
Indicator Notes
Natural year-to-year variability in air temperatures and other factors can influence water temperatures. This indicator accounts for these types of variations by focusing on long-term trends over 25 years of data. Water temperatures can also vary at different locations within a lake. Measurements taken at one location may be representative of the lake as a whole, but it is also possible that other parts of the lake have warmed or cooled at different rates. This indicator uses nighttime measurements to avoid being overly influenced by short-term heating during the day.
This indicator is limited to summer temperatures because these measurements are not likely to be distorted by ice cover. Summer measurements are particularly useful because this time of year is when many aquatic organisms are most active. For example, summer is the peak season for the growth of algae, and summer maximum temperatures determine whether lakes and ponds can support certain types of coldwater fish, such as trout. Summer lake temperatures are important as they influence how the water separates into warm and cold layers, which affects mixing and the availability of oxygen and nutrients.
Data Sources
Satellite data were collected by the National Oceanic and Atmospheric Administration and the European Space Agency and processed by a group of researchers from multiple organizations called the Global Lake Temperature Collaboration. Processed data for each lake are available from the Long Term Ecological Research Network Data Portal at: https://portal.edirepository.org/nis/home.jsp.
Technical Documentation
References
1 Trtanj, J., L. Jantarasami, J. Brunkard, T. Collier, J. Jacobs, E. Lipp, S. McLellan, S. Moore, H. Paerl, J. Ravenscroft, M. Sengco, and J. Thurston. 2016. Chapter 6: Climate impacts on water-related illness. In: The impacts of climate change on human health in the United States: A scientific assessment. U.S. Global Change Research Program.
2 Rahel, F.J., and J.D. Olden. 2008. Assessing the effects of climate change on aquatic invasive species. Conserv. Biol. 22(3):521–533.
3 Sharma, S., et al. 2015. A global database of lake surface temperatures collected by in situ and satellite methods from 1985–2009. Sci. Data 2:150008. doi:10.1038/sdata.2015.8.

