Climate Change Indicators: Marine Species Distribution
This indicator examines changes in the location of fish, shellfish, and other marine species along U.S. coasts.
Figure 1. Change in Latitude and Depth of Marine Species, 1974–2022
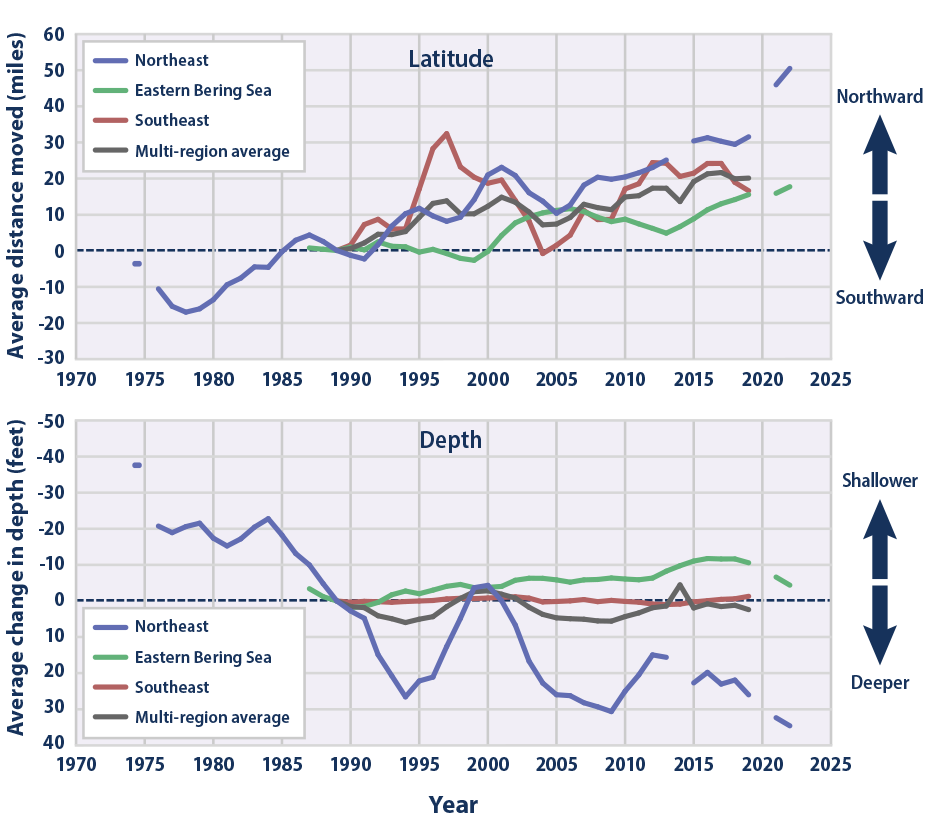
These graphs show the annual change in latitude (movement in miles) and depth (feet) of 41 marine species along the Northeast coast, 58 in the eastern Bering Sea, and 58 along the Southeast coast. The multi-region average consists of 157 unique species. Changes in the centers of biomass have been aggregated across all species and by region. For each region, the change in latitude and change in depth are set at zero for a base year, 1989.
Data source: NOAA, 20243
Web update: June 2024
Figure 2. Average Locations of Three Fish and Shellfish Species in the Northeast, 1974–2022
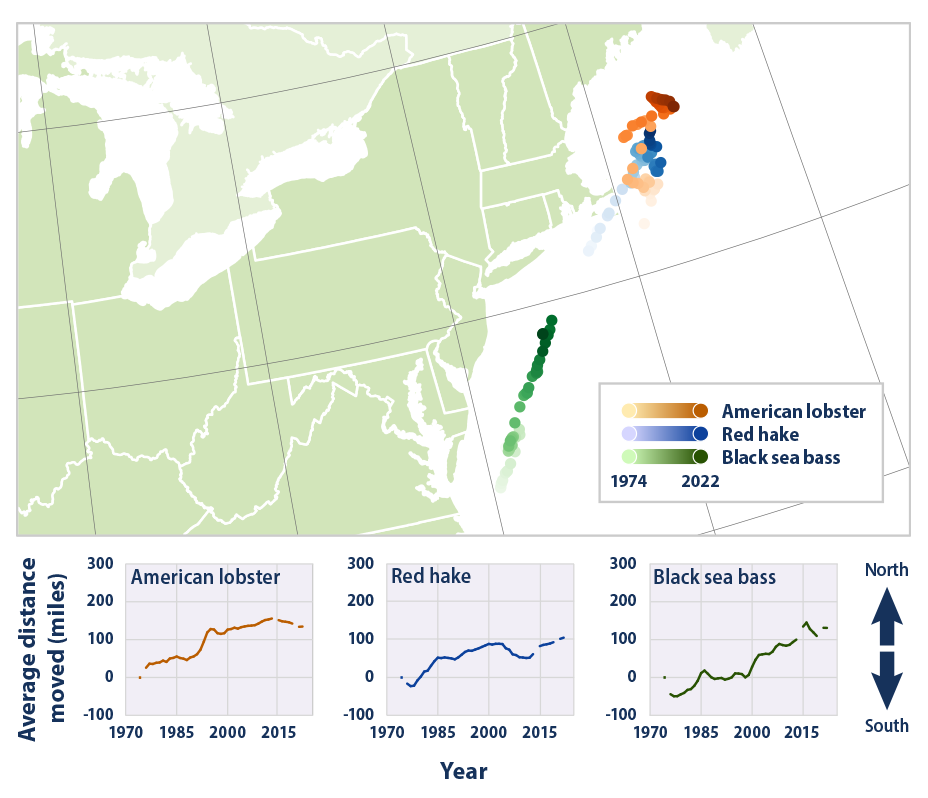
This map shows the annual centers of biomass for three species in the northeastern United States from 1974 to 2022. Dots are shaded from light to dark to show change over time.
Data source: NOAA, 20243
Web update: June 2024
Figure 3. Average Locations of Three Fish and Shellfish Species in the Bering Sea, 1985–2022
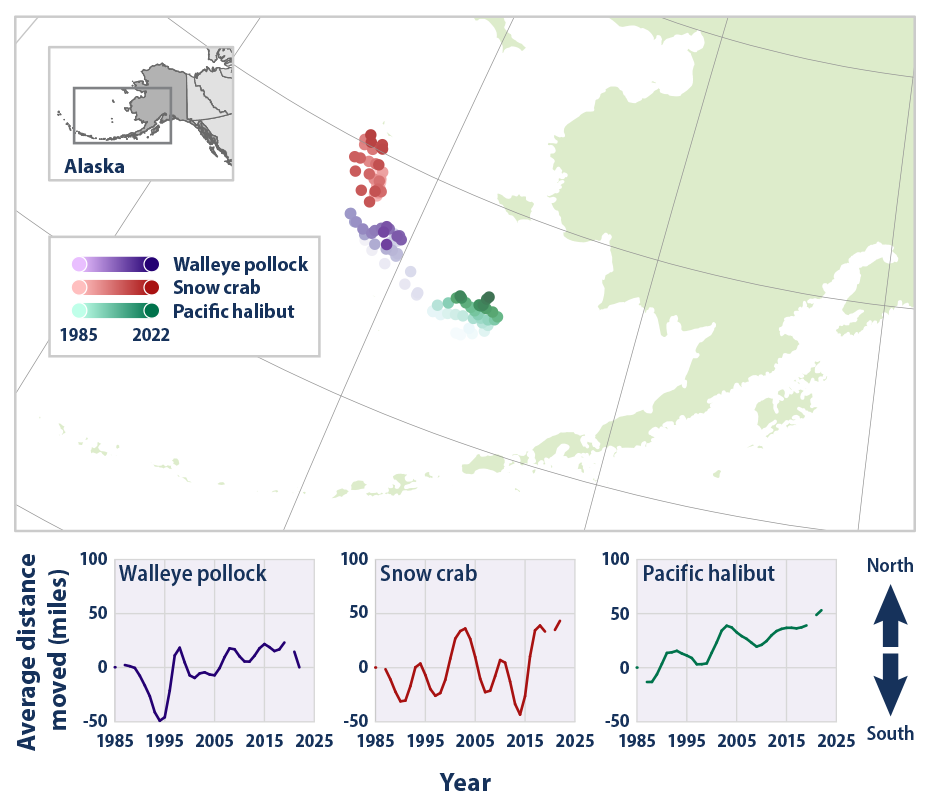
This map shows the annual centers of biomass for three species in the eastern Bering Sea from 1985 to 2022. Dots are shaded from light to dark to show change over time.
Data source: NOAA, 20243
Web update: June 2024
Figure 4. Average Locations of Three Fish Species in the Southeast, 1984–2019
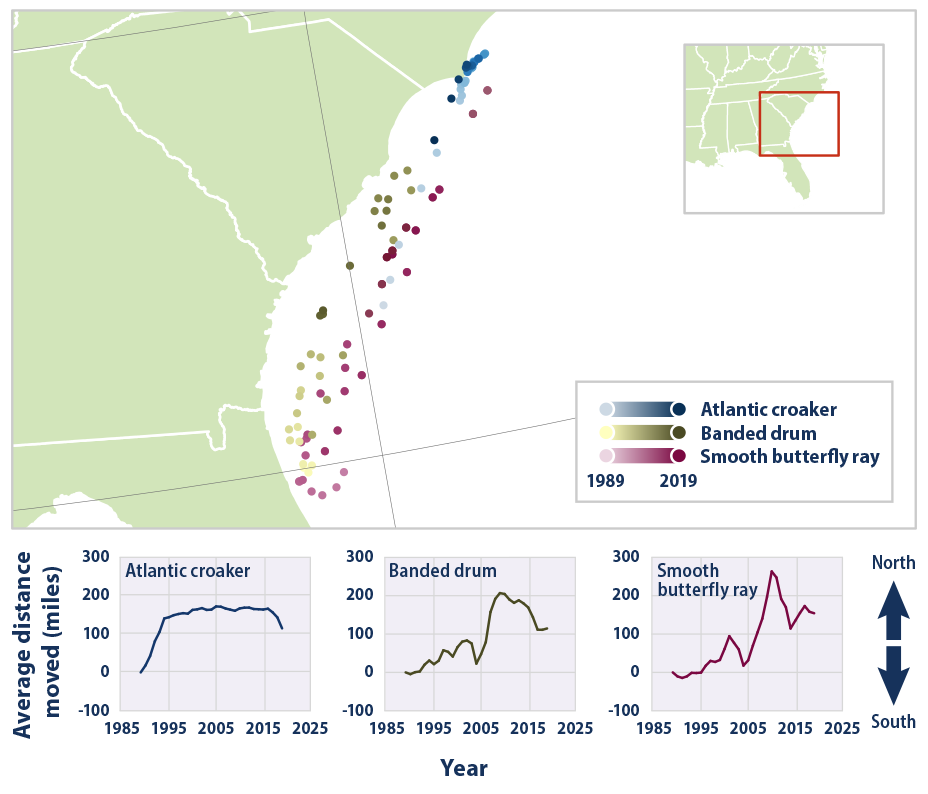
This map shows the annual centers of biomass for three species in the southeastern United States from 1989 to 2019. Dots are shaded from light to dark to show change over time.
Data source: NOAA, 20243
Web update: June 2024
Key Points
- The average center of biomass for 157 marine fish and invertebrate species shifted northward by nearly 17 miles between 1989 and 2019 (Figure 1). These species also moved an average of 0.6 feet deeper.
- In waters off the northeastern United States, several economically important species have shifted northward since the 1970s (Figure 2). The three species shown in Figure 2 (American lobster, red hake, and black sea bass) have moved northward by an average of 145 miles.
- In the Bering Sea, walleye pollock, snow crab, and Pacific halibut have generally shifted away from the coast since the 1980s (Figure 3). They have also moved northward by an average of 41 miles.
- In waters off the southeastern United States, several species have shifted northward since the late 1980s (Figure 4). The three species shown in Figure 4 (Atlantic croaker, banded drum, and smooth butterfly ray) have moved northward by an average of 169 miles.
Background
Changes in water temperature can affect the environments where fish, shellfish, and other marine species live. Certain fish species naturally migrate in response to seasonal temperature changes, moving northward or to deeper, cooler waters in the summer and migrating back during the winter. As climate change causes the oceans to become warmer year-round (see the Ocean Heat and Sea Surface Temperature indicators), however, populations of some species may adapt by shifting away from areas that have become too warm and toward areas that were previously cooler. Along U.S. coasts, this means a shift northward or to deeper waters that may have a more suitable temperature. As smaller prey species shift their habitats, larger predator species may follow them.
Marine species represent a particularly good indicator of warming oceans because they are sensitive to climate and because they have been studied and tracked for many years. Fish are especially mobile, and they may shift their location more easily than species on land because they face fewer physical barriers.1 Also, many marine species, especially fish, do not have fixed nesting places or dwellings that might otherwise compel them to stay in one place. Populations of many marine species have been measured consistently for several decades across various types of ocean habitats. Tracking data from many species is useful because if a change in behavior or distribution occurs across a large range of species, it is more likely the result of a more systematic or common cause.
The movement of species based on their preferred temperature conditions can affect commercial and recreational fisheries, with implications for fisheries management and the economy of communities that rely on fisheries.2 Climate-related fishery losses have already resulted in billions of dollars of lost catch in recent years, directly harming jobs, livelihoods, and local culture.2 Temperature-driven changes in suitable habitats are expected to continue in the future.2
About the Indicator
This indicator tracks marine animal species in terms of their “center of biomass,” which is a point on the map that represents the center of each species’ distribution by weight. If a fish population were to shift generally northward, the center of biomass would shift northward as well. This approach is similar to the way changes in bird population distributions have been measured (see the Bird Wintering Ranges indicator).
Data for this indicator were collected by the National Oceanic and Atmospheric Administration’s National Marine Fisheries Service and other agencies. These agencies monitor marine species populations by conducting annual surveys in which they trawl the ocean at regular intervals along the coast. By recording what they catch at each location, scientists can calculate each species’ center of biomass in terms of latitude, longitude, and depth.
This indicator focuses on three survey regions that have the most continuous and longest-running sampling: the Northeast, the eastern Bering Sea off the coast of Alaska, and the Southeast. Figure 1 shows the average change in the center of biomass across 157 species in these regions as well as changes by region. For consistency, each line in Figure 1 is limited to species with the most complete records throughout the timeframe shown. Figures 2, 3, and 4 show detailed changes for three species in each region. These species were chosen because they represent a variety of habitats and species types (a mixture of fish and shellfish) and because they tend to be fairly abundant. Some of these species support major fisheries, but are presumed not to be heavily affected by overfishing, reducing the chance that fishing is unduly influencing the observed trends. Northeast data come from surveys that have been conducted every spring since 1974, Bering Sea data come from summer surveys that have been conducted consistently since 1985, and Southeast data come from surveys that have been conducted every spring since 1989.
About the Data
Indicator Notes
Water temperature is not the only factor that can cause marine animal populations to shift. Other factors could include interactions with other species, harvesting, ocean circulation patterns, habitat change, and species’ ability to disperse and adapt. As a result, species might have moved northward for reasons other than, or in addition to, changing sea temperatures. This indicator is limited to the Northeast, the eastern Bering Sea, and the Southeast because these areas have used consistent survey methods and because they do not have coastlines that would prevent species from moving northward in response to warming (in contrast to regions like the Gulf of America, where the coast blocks northward migration).
Data Sources
Data for this indicator were collected by the National Oceanic and Atmospheric Administration’s National Marine Fisheries Service during annual bottom trawl fisheries surveys. These data have been processed and made publicly available through the Distribution Mapping and Analysis Portal at: https://apps-st.fisheries.noaa.gov/dismap/DisMAP.html. Data from these surveys have been used to support a wide variety of studies.1,4-6
Technical Documentation
References
1 Pinsky, M. L., Worm, B., Fogarty, M. J., Sarmiento, J. L., & Levin, S. A. (2013). Marine taxa track local climate velocities. Science, 341(6151), 1239–1242. https://doi.org/10.1126/science.1239352
2 Mills, K. E., Osborne, E. B., Bell, R. J., Colgan, C. S., Cooley, S. R., Goldstein, M. C., Griffis, R. B., Holsman, K., Jacox, M., & Micheli, F. (2023). Chapter 10: Ocean ecosystems and marine resources. In USGCRP (U.S. Global Change Research Program), Fifth National Climate Assessment. https://doi.org/10.7930/NCA5.2023.CH10
3 NOAA (National Oceanic and Atmospheric Administration). (2024). DisMAP data records. Distribution Mapping and Analysis Portal. Retrieved May 6, 2024, from https://apps-st.fisheries.noaa.gov/dismap/DisMAP.html
4 Morley, J. W., Selden, R. L., Latour, R. J., Frölicher, T. L., Seagraves, R. J., & Pinsky, M. L. (2018). Projecting shifts in thermal habitat for 686 species on the North American continental shelf. PLOS ONE, 13(5), e0196127. https://doi.org/10.1371/journal.pone.0196127
5 USGCRP (U.S. Global Change Research Program). (2018). Impacts, risks, and adaptation in the United States: Fourth National Climate Assessment, volume II (D. R. Reidmiller, C. W. Avery, D. R. Easterling, K. E. Kunkel, K. L. M. Lewis, T. K. Maycock, & B. C. Stewart, Eds.). https://doi.org/10.7930/NCA4.2018.RiB
6 USGCRP (U.S. Global Change Research Program). (2021). USGCRP indicators: Marine species distribution.
Learn about other indicators in this section