Climate Change Indicators: Sea Surface Temperature
This indicator describes global trends in sea surface temperature.
Figure 1. Average Global Sea Surface Temperature, 1880–2023
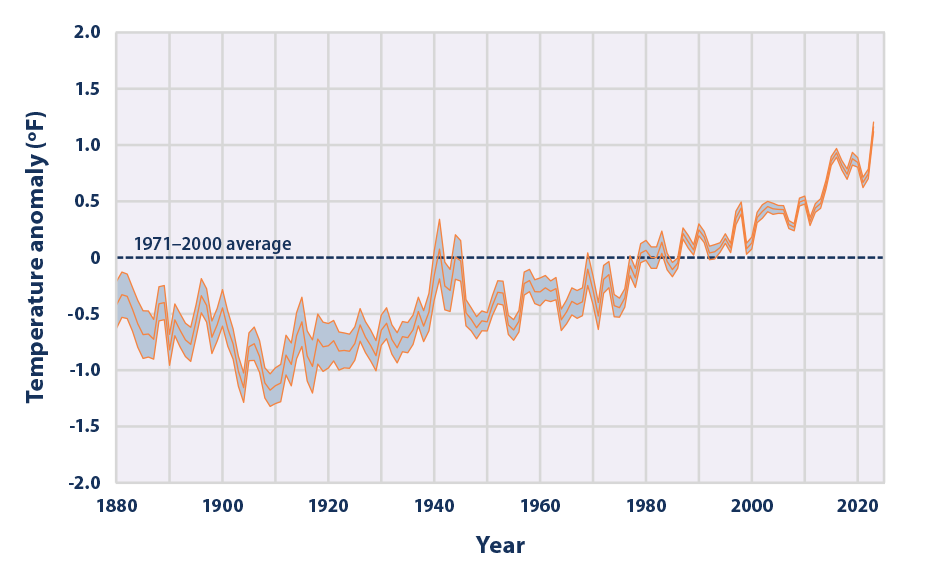
This graph shows how the average surface temperature of the world’s oceans has changed since 1880. This graph uses the 1971 to 2000 average as a baseline for depicting change. Choosing a different baseline period would not change the shape of the data over time. The shaded band shows the range of uncertainty in the data, based on the number of measurements collected and the precision of the methods used.
Data source: NOAA, 20247
Web update: June 2024
Figure 2. Change in Sea Surface Temperature, 1901–2022
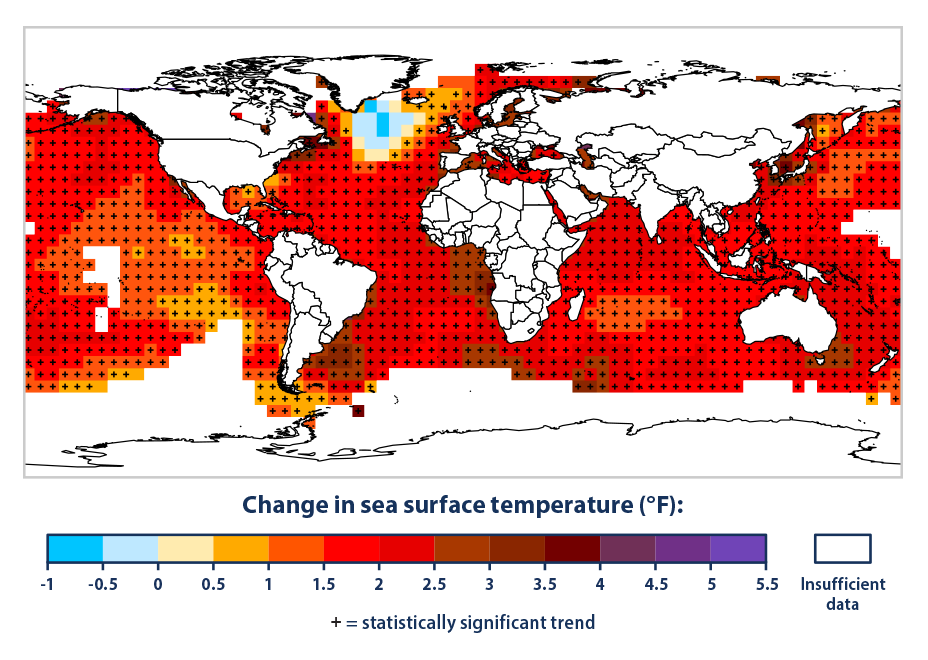
This map shows how average sea surface temperature around the world changed between 1901 and 2022. It is based on a combination of direct measurements and satellite measurements. A black “+” symbol in the middle of a square on the map means the trend shown is statistically significant. White areas did not have enough data to calculate reliable long-term trends.
Data source: NOAA, 20238
Web update: June 2024
Key Points
- Sea surface temperature increased during the 20th century and continues to rise. From 1901 through 2023, temperature rose at an average rate of 0.14°F per decade (Figure 1).
- Sea surface temperature has been consistently higher during the past three decades than at any other time since reliable observations began in 1880. The year 2023 was the warmest ever recorded (Figure 1).
- Based on the historical record, increases in sea surface temperature have largely occurred over two key periods: between 1910 and 1940 and from about 1970 to the present. Sea surface temperature appears to have cooled between 1880 and 1910 (Figure 1).
- Changes in sea surface temperature vary regionally. While most parts of the world’s oceans have seen temperature rise, a few areas have actually experienced cooling—for example, parts of the North Atlantic (Figure 2).
Background
Sea surface temperature—the temperature of the water at the ocean surface—is an important physical attribute of the world’s oceans. The surface temperature of the world’s oceans varies mainly with latitude, with the warmest waters generally near the equator and the coldest waters in the Arctic and Antarctic regions. As the oceans absorb more heat, sea surface temperature increases, and the ocean circulation patterns that transport warm and cold water around the globe change.
Changes in sea surface temperature can alter marine ecosystems in several ways. For example, variations in ocean temperature can affect what species of plants, animals, and microbes are present in a location, alter migration and breeding patterns, threaten sensitive ocean life such as corals, and change the frequency and intensity of harmful algal blooms such as “red tide.”1 Over the long term, increases in sea surface temperature could also reduce the circulation patterns that bring nutrients from the deep sea to surface waters. Changes in reef habitat and nutrient supply could dramatically alter ocean ecosystems and lead to declines in fish populations, which in turn could affect people who depend on fishing for food or jobs.2,3 Many coastal areas have a large share of people who depend on income from fishing, tourism, or both. This is especially common in areas that have fewer economic alternatives, including rural counties and the United States’ Caribbean and Pacific island commonwealths and territories.4
Because the oceans continuously interact with the atmosphere, sea surface temperature can also have profound effects on global climate. Increases in sea surface temperature have led to an increase in the amount of atmospheric water vapor over the oceans.5 This water vapor feeds weather systems that produce precipitation, increasing the risk of heavy rain and snow (see the Heavy Precipitation and Tropical Cyclone Activity indicators). Changes in sea surface temperature can shift storm tracks, potentially contributing to droughts in some areas.5 Increases in sea surface temperature are also expected to lengthen the growth season for certain bacteria that can contaminate seafood and cause foodborne illnesses, thereby increasing the risk of health effects.6
About the Indicator
This indicator tracks average global sea surface temperature from 1880 through 2023. It also includes a map to show how change in sea surface temperature has varied across the world’s oceans from 1901 to 2022.
Techniques for measuring sea surface temperature have evolved since the 1800s. For instance, the earliest data were collected by inserting a thermometer into a water sample collected by lowering a bucket from a ship. Today, temperature measurements are collected more systematically from ships, as well as at stationary and drifting buoys.
The National Oceanic and Atmospheric Administration has carefully reconstructed and filtered the data in Figure 1 to correct for biases in the different collection techniques and to minimize the effects of sampling changes over various locations and times. The data are shown as anomalies, or differences, compared with the average sea surface temperature from 1971 to 2000. The map in Figure 2 was originally developed by the Intergovernmental Panel on Climate Change, which calculated long-term trends based on a collection of published studies.
About the Data
Indicator Notes
Both components of this indicator are based on instrumental measurements of surface water temperature. Due to denser sampling and improvements in sampling design and measurement techniques, newer data are more precise than older data. The earlier trends shown by this indicator have less certainty because of lower sampling frequency and less precise sampling methods.
Data Sources
Data for Figure 1 were provided by the National Oceanic and Atmospheric Administration’s National Centers for Environmental Information and are available online at: www.ncei.noaa.gov/products/extended-reconstructed-sst. These data were reconstructed from measurements of water temperature, which are available from the National Oceanic and Atmospheric Administration at: https://icoads.noaa.gov/products.html. Figure 2 is an updated version of a map that appeared in the Intergovernmental Panel on Climate Change’s Fifth Assessment Report (www.ipcc.ch/report/ar5/wg1), which gathered data from a variety of studies that provide the best available information about climate change.
Technical Documentation
References
1 Ostrander, G. K., Armstrong, K. M., Knobbe, E. T., Gerace, D., & Scully, E. P. (2000). Rapid transition in the structure of a coral reef community: The effects of coral bleaching and physical disturbance. Proceedings of the National Academy of Sciences, 97(10), 5297–5302. https://doi.org/10.1073/pnas.090104897
2 Pratchett, M. S., Wilson, S. K., Berumen, M. L., & McCormick, M. I. (2004). Sublethal effects of coral bleaching on an obligate coral feeding butterflyfish. Coral Reefs, 23(3), 352–356. https://doi.org/10.1007/s00338-004-0394-x
3 Pershing, A., Griffis, R., Jewett, E. B., Armstrong, C. T., Bruno, J. F., Busch, S., Haynie, A. C., Siedlecki, S., & Tommasi, D. (2018). Chapter 9: Oceans and marine resources. In USGCRP (U.S. Global Change Research Program), Impacts, risks, and adaptation in the United States: The Fourth National Climate Assessment, volume II. https://doi.org/10.7930/NCA4.2018.CH9
4 Mills, K. E., Osborne, E. B., Bell, R. J., Colgan, C. S., Cooley, S. R., Goldstein, M. C., Griffis, R. B., Holsman, K., Jacox, M., & Micheli, F. (2023). Chapter 10: Ocean ecosystems and marine resources. In USGCRP (U.S. Global Change Research Program), Fifth National Climate Assessment. https://doi.org/10.7930/NCA5.2023.CH10
5 Douville, H., Raghavan, K., Renwick, J., Allan, R. P., Arias, P. A., Barlow, M., Cerezo-Mota, R., Cherchi, A., Gan, T. Y., Gergis, J., Jiang, D., Khan, A., Pokam Mba, W., Rosenfeld, D., Tierney, J., & Zolina, O. (2021). Chapter 8: Water cycle changes. In IPCC (Intergovernmental Panel on Climate Change), Climate change 2021—The physical science basis: Working Group I Contribution to the Sixth Assessment Report of the Intergovernmental Panel on Climate Change. Cambridge University Press. https://doi.org/10.1017/9781009157896
6 Trtanj, J., Jantarasami, L., Brunkard, J., Collier, T., Jacobs, J., Lipp, E., McLellan, S., Moore, S., Paerl, H., Ravenscroft, J., Sengco, M., & Thurston, J. (2016). Chapter 6: Climate impacts on water-related illness. In USGCRP (U.S. Global Change Research Program), The impacts of climate change on human health in the United States: A scientific assessment (pp. 157–188).
7 Huang, B., Thorne, P. W., Banzon, V. F., Boyer, T., Chepurin, G., Lawrimore, J. H., Menne, M. J., Smith, T. M., Vose, R. S., & Zhang, H.-M. (2024). NOAA Extended Reconstructed Sea Surface Temperature (ERSST), version 5 [Data set]. Retrieved February 1, 2024, from https://doi.org/10.7289/V5T72FNM
8 Huang, B., Yin, X., Menne, M. J., Vose, R., & Zhang, H. (2023). NOAA Global Surface Temperature Dataset, version 6 [Data set]. Accessed March 2024. www.ncei.noaa.gov/metadata/geoportal/rest/metadata/item/gov.noaa.ncdc%3AC01704/html
Learn about other indicators in this section