U.S. flag

An official website of the United States government

Here’s how you know

Dot gov

Official websites use .gov
A .gov website belongs to an official government organization in the United States.

HTTPS

Secure .gov websites use HTTPS
A lock (LockA locked padlock) or https:// means you’ve safely connected to the .gov website. Share sensitive information only on official, secure websites.

    • Environmental Topics
    • Air
    • Bed Bugs
    • Cancer
    • Chemicals, Toxics, and Pesticide
    • Emergency Response
    • Environmental Information by Location
    • Health
    • Land, Waste, and Cleanup
    • Lead
    • Mold
    • Radon
    • Research
    • Science Topics
    • Water Topics
    • A-Z Topic Index
    • Laws & Regulations
    • By Business Sector
    • By Topic
    • Compliance
    • Enforcement
    • Laws and Executive Orders
    • Regulations
    • Report a Violation
    • Environmental Violations
    • Fraud, Waste or Abuse
    • About EPA
    • Our Mission and What We Do
    • Headquarters Offices
    • Regional Offices
    • Labs and Research Centers
    • Planning, Budget, and Results
    • Organization Chart
    • EPA History

Breadcrumb

  1. Home
  2. Climate Change Indicators
  3. About the Indicators
  4. Publications

Climate Change Indicators in the United States: Fifth Edition
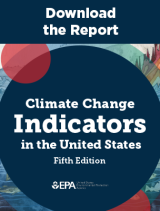
Fifth Edition report cover.

The fifth edition of Climate Change Indicators in the United States documents how climate change is impacting the United States today, the significance of these changes, and their possible consequences for people, the environment, and society.

Using EPA's climate change indicators and relevant scientific literature, the report groups indicators into eight themes that help to show interconnections, cause-and-effect relationships, and how physical changes in the atmosphere affect people and the environment. Indicators related to human health and societal impacts of climate change cut across chapter themes and are integrated throughout the report. Each theme includes information on why the changes matter, as well as examples and discussion of the unequal impacts of climate change. The report also provides examples of what people and communities can do to address climate change, and what actions are already underway.

  • Read the report (PDF)
  • Read the technical documentation (PDF)
  • Corrigenda (PDF)
  • Recommended citation: U.S. Environmental Protection Agency. (2024). Climate change indicators in the United States (Fifth ed., EPA 430-R-24-003). www.epa.gov/climate-indicators

Themes Covered in the Report

   
Painting of birds in a blue sky.

Greenhouse Gases: As greenhouse gas emissions from human activities increase, they build up in the atmosphere and warm the climate, leading to many other changes around the world—in the atmosphere, on land, and in the oceans. The indicators presented in other chapters of this report and on EPA’s website illustrate many of these changes and their effects on people, society, and the environment.

Painting of a city skyline.

Heat on the Rise: As the concentrations of heat-trapping greenhouse gases in the atmosphere continue to increase, the United States has experienced warming temperatures, more unusually hot summer days, and more frequent heat waves that threaten people’s health and strain the electric power grid.

Painting of flowing water.
Extreme Events: Rising global average temperature is associated with widespread changes in weather patterns. Extreme events such as heavy rainstorms, hurricanes, floods, droughts, and wildfires have happened throughout history, but human-induced climate change is expected to make these events more frequent and/or intense. While risks vary across the country, these events are among the nation’s costliest disasters, sometimes causing great damage to ecosystems, communities, and the economy.
Painting of a lake.
Water Resources at Risk: Clean fresh water is essential to life on the Earth, and climate change is affecting the planet’s water resources. As the climate warms, changing precipitation patterns, drought, decreasing amounts of snow, and earlier snowmelt all pose risks to water supplies in the United States, affecting communities, livelihoods, and ecosystems.
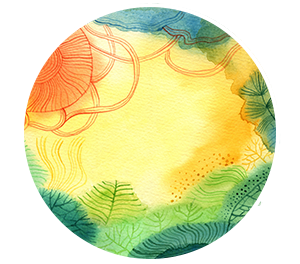
Abstract painting of the sun shining on grass.
Changing Seasons: Although the timing, duration, and intensity of the seasons vary naturally from year to year, climate change is driving longer-term changes in seasonality and fundamentally altering the ways in which humans and natural systems experience and interact with seasonal events. These changes lead to wide-ranging impacts such as warmer winters, lakes thawing earlier, longer growing seasons, and worsening allergies for people.
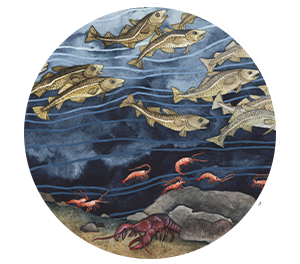
Painting of fish in the sea.
Ocean Impacts: The heat-trapping greenhouse gases that humans have added to the atmosphere are making the Earth’s oceans warmer and more acidic. Changes in the oceans affect the Earth’s climate and weather patterns and threaten marine ecosystems and biodiversity and the people whose livelihoods depend on them.
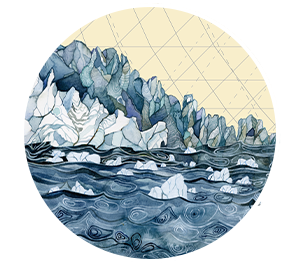
Painting of glaciers in the sea.
Rising Seas: As the temperature of the Earth changes, so does sea level throughout the world’s oceans. Water from melting ice sheets and glaciers on land ultimately flows into the ocean. Also, as water in the ocean warms, it expands slightly, increasing the volume of water in the ocean. Both of these factors contribute to sea level rise, which increases coastal flooding and other coastal risks.
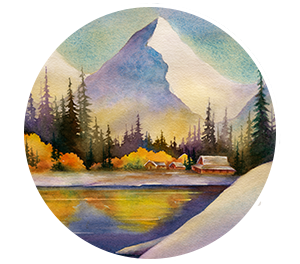
Painting of snow-covered mountains and trees.
Alaska’s Warming Climate: The Arctic is warming more quickly than the rest of the world, as is Alaska—the northernmost U.S. state. Alaska is also uniquely vulnerable to climate change due to its frozen features. Alaska is the only state with widespread permafrost (underlying 80 percent of its land) and significant sea ice extent, which are an integral part of life. Entire ecosystems, communities, and Indigenous ways of life could vanish as these frozen features shrink or disappear.

Related Resources

  • Explore EPA’s climate change indicators 
  • Dig into the data: explore interactive maps
  • Explore data sources and methods, frequently asked questions, and previous publications 

Climate Change Indicators

  • View the Indicators
    • Greenhouse Gases
      • U.S. Greenhouse Gas Emissions
      • Global Greenhouse Gas Emissions
      • Atmospheric Concentrations of Greenhouse Gases
      • Climate Forcing
    • Weather and Climate
      • U.S. and Global Temperature
      • Seasonal Temperature
      • High and Low Temperatures
      • Heat Waves
      • U.S. and Global Precipitation
      • Heavy Precipitation
      • Tropical Cyclone Activity
      • River Flooding
      • Drought
      • A Closer Look: Temperature and Drought in the Southwest
    • Oceans
      • Ocean Heat
      • Sea Surface Temperature
      • Marine Heat Waves
      • Sea Level
      • A Closer Look: Land Loss Along the Atlantic Coast
      • Coastal Flooding
      • Ocean Acidity
    • Snow and Ice
      • Arctic Sea Ice
      • Antarctic Sea Ice
      • Ice Sheets
      • Glaciers
      • Arctic Glaciers
      • A Closer Look: Glaciers in Glacier National Park
      • Lake Ice
      • Great Lakes Ice Cover
      • Community Connection: Ice Breakup in Three Alaskan Rivers
      • Snowfall
      • Snow Cover
      • Snowpack
      • Permafrost
      • Freeze-Thaw Conditions
    • Health and Society
      • Heat-Related Deaths
      • A Closer Look: Heat-Related Workplace Deaths
      • Heat-Related Illnesses
      • Cold-Related Deaths
      • Heating and Cooling Degree Days
      • Residential Energy Use
      • Lyme Disease
      • West Nile Virus
      • Length of Growing Season
      • Growing Degree Days
      • Ragweed Pollen Season
    • Ecosystems
      • Wildfires
      • Streamflow
      • Stream Temperature
      • Tribal Connection: Trends in Stream Temperature in the Snake River
      • Lake Temperature
      • Great Lakes Water Levels and Temperatures
      • Bird Wintering Ranges
      • A Closer Look: The Black Guillemots of Cooper Island
      • Marine Species Distribution
      • Leaf and Bloom Dates
      • Community Connection: Cherry Blossom Bloom Dates in Washington, D.C.
  • Dig into the Data
    • Map Explorer Basics
    • Southwest Case Study
  • Indicator Stories
    • Indicator Infographics
    • Community Connections
    • Indicators Overview StoryMap
    • Seasonality and Climate Change
  • About the Indicators
    • Data Sources and Methods
    • Frequent Questions about the Indicators
    • Publications
Contact Us About Climate Indicators
Contact Us to ask a question, provide feedback, or report a problem.
Last updated on September 12, 2024
  • Assistance
  • Spanish
  • Arabic
  • Chinese (simplified)
  • Chinese (traditional)
  • French
  • Haitian Creole
  • Korean
  • Portuguese
  • Russian
  • Tagalog
  • Vietnamese
United States Environmental Protection Agency

Discover.

  • Accessibility Statement
  • Budget & Performance
  • Contracting
  • EPA www Web Snapshot
  • Grants
  • No FEAR Act Data
  • Plain Writing
  • Privacy
  • Privacy and Security Notice

Connect.

  • Data
  • Inspector General
  • Jobs
  • Newsroom
  • Regulations.gov
  • Subscribe
  • USA.gov
  • White House

Ask.

  • Contact EPA
  • EPA Disclaimers
  • Hotlines
  • FOIA Requests
  • Frequent Questions
  • Site Feedback

Follow.