U.S. flag

An official website of the United States government

Here’s how you know

Dot gov

Official websites use .gov
A .gov website belongs to an official government organization in the United States.

HTTPS

Secure .gov websites use HTTPS
A lock (LockA locked padlock) or https:// means you’ve safely connected to the .gov website. Share sensitive information only on official, secure websites.

    • Environmental Topics
    • Air
    • Bed Bugs
    • Cancer
    • Chemicals, Toxics, and Pesticide
    • Emergency Response
    • Environmental Information by Location
    • Health
    • Land, Waste, and Cleanup
    • Lead
    • Mold
    • Radon
    • Research
    • Science Topics
    • Water Topics
    • A-Z Topic Index
    • Laws & Regulations
    • By Business Sector
    • By Topic
    • Compliance
    • Enforcement
    • Laws and Executive Orders
    • Regulations
    • Report a Violation
    • Environmental Violations
    • Fraud, Waste or Abuse
    • About EPA
    • Our Mission and What We Do
    • Headquarters Offices
    • Regional Offices
    • Labs and Research Centers
    • Planning, Budget, and Results
    • Organization Chart
    • EPA History

Breadcrumb

  1. Home
  2. Smart Growth

Impervious Surface Growth Model

Stormwater runoff is a major contributor to water pollution. When rainwater washes over impervious surfaces such as rooftops, parking lots, and roads, it collects and carries pollutants that ultimately flow into waterways. Smart growth strategies can help to reduce the impact of new development on stormwater runoff by preserving open spaces and focusing new construction in developed areas, which reduces the amount of new impervious surface per unit of development.

On this page:

  • What is the Impervious Surface Growth Model?
  • How to Use the Tool
  • Resources to Improve Water Quality

What is the Impervious Surface Growth Model?

Featured Resource

Download the ISGM spreadsheet and supporting database (XLSX). 

Learn more by reading  A Placed-Based Tool for Assessing Cumulative Impervious Surface Outcomes of Proposed Development Scenarios (pdf) (9.75 MB)

EPA created the Impervious Surface Growth Model (ISGM) to help communities estimate and compare the likely impervious surface impacts of proposed housing and commercial development scenarios.

The ISGM spreadsheet tool is well suited for sketch planning applications when more detailed and site-specific stormwater runoff analysis is not possible. Analysts can also integrate ISGM with other tools for more detailed studies of stormwater and water quality impacts.

The article A Placed-Based Tool for Assessing Cumulative Impervious Surface Outcomes of Proposed Development Scenarios (pdf) (9.75 MB)  describes the impetus for ISGM, the development of the model, its intended uses and limitations, and some anticipated future enhancements.


How to Use this Tool

The Impervious Surface Growth Model spreadsheet tool is pre-loaded with baseline data for all U.S. census block groups.1  Communities can use ISGM without the need for additional baseline data or calibration for the local area of analysis. 

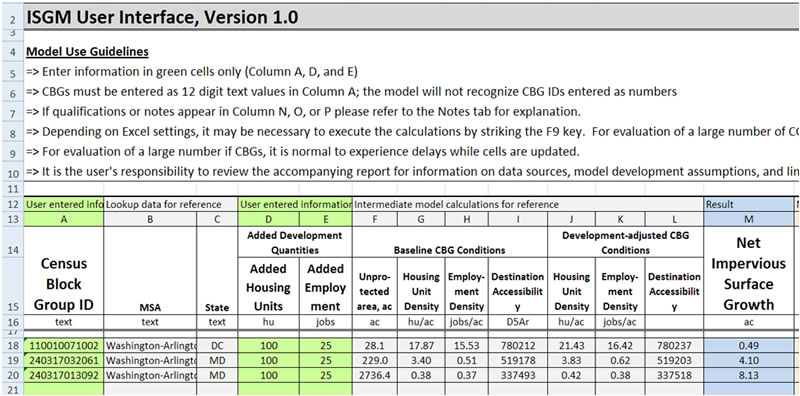
Users of the ISGM spreadsheet tool provide the following inputs:

  • Census block group1 identifier (use the Census Block Group ID Finder to look up).
  • Census block group FIPS code (use this tool to find the FIPS code for your location)
  • Number of new homes proposed to be built in the block group.
  • Number of new jobs (post-construction) expected to be located in the block group

The ISGM spreadsheet then calculates acres of new impervious surface associated with the development scenario. Below is a screenshot of the ISGM spreadsheet user interface. Columns in green accept user input. The blue column shows the resulting calculation.

Screenshot of ISGM user interface
Screenshot of the ISGM spreadsheet tool interface
One unique feature of ISGM is its sensitivity to development location. This tool models impervious surface growth based on density of housing and jobs as well as destination accessibility (the relative centrality within the surrounding metropolitan region). Baseline data for each of these variables comes from EPA’s Smart Location Database.

Resources to Improve Water Quality

For more information on how land use can help limit stormwater runoff and improve water quality, please see the EPA publications and resources: 

  • Land Use and Green Infrastructure Scorecard (2023)
  • Water Topics (2023)
  • City Green: Innovative Green Infrastructure Solutions for Downtowns and Infill Locations (2016)
  • Protecting Water Resources With Higher-Density Development (2006)
  • Using Smart Growth Techniques as Stormwater Best Management Practices (2005)

1 Block groups are contained within census tracts and generally contain between 600 and 3,000 people, with an optimum size of 1,500 people. The land area of block groups varies based on population density.

Smart Growth

  • About Smart Growth
  • Technical Assistance
  • Examples of Smart Growth
  • Publications
  • Tools
  • Topics
  • Webinars, Videos, and Podcasts
  • Smart Growth in Your Community
Contact Us about Smart Growth
Contact Us to ask a question, provide feedback, or report a problem.
Last updated on December 13, 2024
  • Assistance
  • Spanish
  • Arabic
  • Chinese (simplified)
  • Chinese (traditional)
  • French
  • Haitian Creole
  • Korean
  • Portuguese
  • Russian
  • Tagalog
  • Vietnamese
United States Environmental Protection Agency

Discover.

  • Accessibility Statement
  • Budget & Performance
  • Contracting
  • EPA www Web Snapshot
  • Grants
  • No FEAR Act Data
  • Plain Writing
  • Privacy
  • Privacy and Security Notice

Connect.

  • Data
  • Inspector General
  • Jobs
  • Newsroom
  • Regulations.gov
  • Subscribe
  • USA.gov
  • White House

Ask.

  • Contact EPA
  • EPA Disclaimers
  • Hotlines
  • FOIA Requests
  • Frequent Questions
  • Site Feedback

Follow.