
Guide to Using TRI Data to Reduce Pollution in Your Community
This guide is intended for individuals and organizations working to reduce industrial pollution in communities. It will help you understand how to use Toxics Release Inventory (TRI) data and other EPA resources to identify opportunities to prevent or reduce pollution from local industrial facilities. It also tells you what you can do to help implement those solutions. Each of the four steps below includes recommended approaches, tips, and additional resources.
FIND TRI data for your area of interest.
IDENTIFY potential concerns.
IDENTIFY potential solutions.
TAKE ACTION to advance solutions.
Step 1: Find TRI Data for Your Area of Interest
Search for a Community
The TRI Toxics Tracker tool is one simple way to access community-level TRI data. Use the dropdown menu in the 'Search for a Community' box to view a printable 4-page Community Profile report from Toxics Tracker.
To explore the data in more detail, use the full version of TRI Toxics Tracker. It includes additional information about chemical releases, other types of chemical waste management, pollution prevention activities, waste transfers, facility locations, community characteristics, and more.

Step 2: Identify Potential Concerns
Once you have the TRI Community Profile or have searched for your community using the TRI Toxics Tracker, you may want to identify potential health or environmental concerns. TRI data cover a range of chemical waste management activities, including releases of toxic chemicals into the air, water, and land.
Below are seven questions to help you identify potential concerns in your community as you review the TRI data. The references indicate where to find the relevant information in the printed version of the TRI Community Profile and in the TRI Toxics Tracker tool.
1. What was the total amount of chemical releases reported?
You can look at the total amount of chemical releases by geography, environmental media, chemical, facility, and industry sector as a useful starting point for identifying potential risks to human health and the environment. Be aware: the TRI doesn't include all the information you need to determine whether or to what extent a community has been exposed to toxic chemicals or is at risk from chemical releases.
While the TRI includes information on many toxic chemicals used by industry, it does not cover all toxic chemicals, all facilities, or all sources of toxic chemicals in communities. For example, TRI does not cover exhaust from cars and trucks, chemicals in consumer products, and pesticide residues in food and water. Also, the TRI does not typically cover smaller facilities such as dry cleaners and autobody shops.
Where to Find This Information
- Community Profile: TRI Summary Table (page 1 of printout)
- TRI Toxics Tracker: Releases section
Example: Summary of TRI Data for Louisville, KY
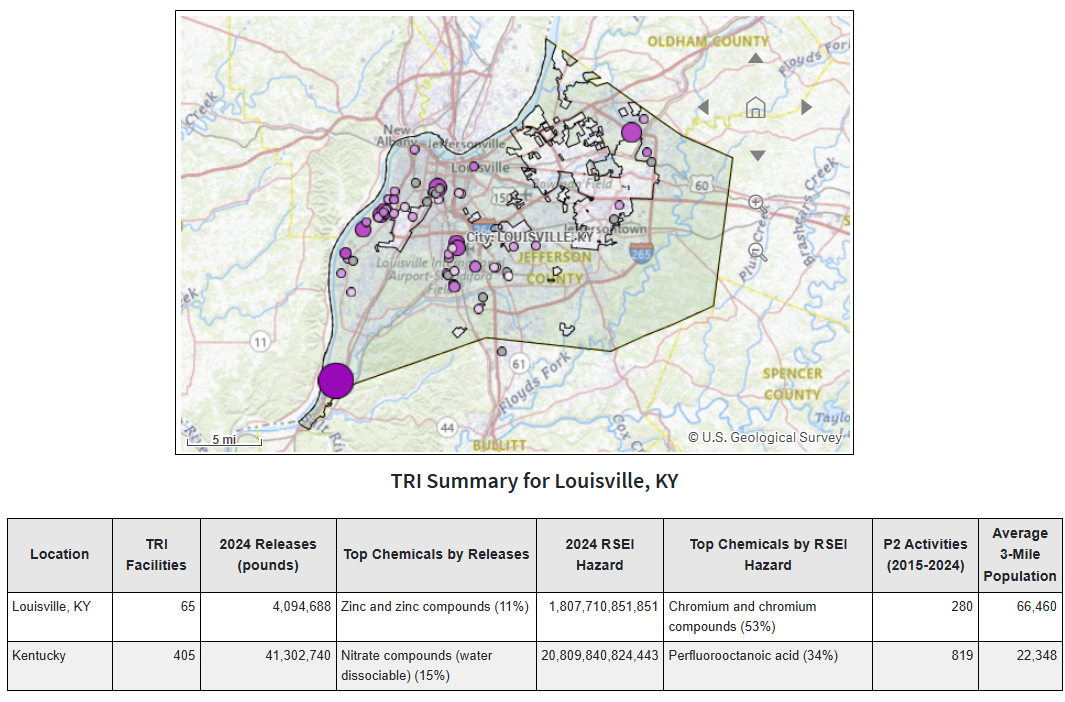
The map shows the facilities in Louisville that reported TRI data for 2024. Each marker is sized and colored based on the facility’s total release quantity, so you can quickly see where the largest releases and off-site transfers were reported.
The table summarizes key TRI metrics for Louisville and the state of Kentucky, including the number of facilities and the total amount of chemical releases they reported for 2024.
2. How were the chemicals released into the environment?
TRI provides information about whether a facility released chemicals into the air, water, or land, but not all releases are equally risky. People may be more likely to be exposed to chemicals released to the air or water than to chemicals released to the land. For example, some releases are disposals into highly controlled landfills that people are unlikely to encounter while other releases go directly into the air that people may breathe. Some land disposal types, however, such as waste piles and holding ponds, may be more susceptible to flooding or other weather-related events, potentially exposing nearby communities to chemicals.
Some facilities send waste containing chemicals to other facilities that are better able to handle it. Facilities report the amounts of TRI-covered chemicals in this waste, and they are called "off-site transfers." The receiving facility may then dispose of that waste or release it into the environment, which is called "off-site releases." If there is a facility in your community that receives chemical waste transfers, you may be interested in the TRI waste transfer data.
Note that the TRI does not have information about the logistics of chemical waste transfers, such as loading trucks, transportation through neighborhoods, and unloading and handling at the receiving facility.
Where to Find This Information
- Community Profile: Summary of Releases pie charts (page 2 of printout)
- TRI Toxics Tracker: Releases section
Example: Top 5 Chemicals by Environmental Media in Louisville, KY
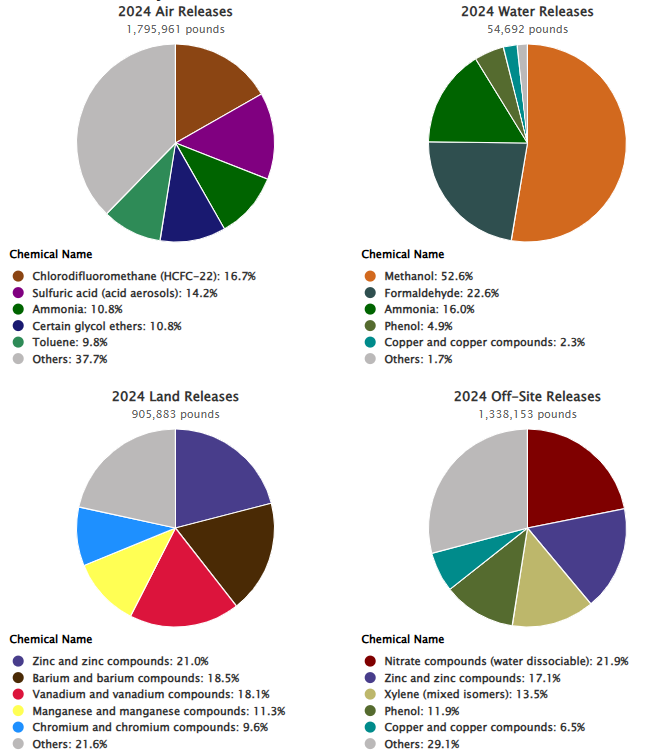
These pie charts show the top chemicals released into the air, water, and land, as well as the chemicals transferred off site. You can look at the way chemicals were released to better understand chemical management in your community and where to focus your attention. For example, although large amounts of nitrate compounds were transferred off site in Louisville, air and water releases often have a more direct impact on nearby populations.
3. What chemicals were released in the largest quantities? What chemicals might have the greatest impact on human health?
If you only look at the quantity of chemicals that are released, you might not get the full picture of potential human health or environmental risks. For example, a chemical that is very toxic but released in a small amount may pose a greater risk than a less toxic chemical that is released in a larger amount.
EPA developed the Risk Screening Environmental Indicators (RSEI) model to help assess potential health-related impacts of toxic chemical releases. “RSEI Hazard” is one of the results produced by the RSEI model. It reflects the amount of a chemical released into the environment and its relative potential to harm people. RSEI Hazard is calculated by multiplying the amount of a chemical that a facility releases by a numeric value that represents the toxicity of the chemical. This means that chemicals that are more toxic will lead to higher RSEI Hazard values.
The RSEI Hazard metric is used in multiple sections of the TRI Community Profile and the TRI Toxics Tracker tool to help you identify the chemicals that may have the greatest impact on human health.
Where to Find This Information
- Community Profile: TRI Summary Table and Trends in Releases and RSEI Hazard (page 1 of printout); Summary of RSEI Hazard (page 3 of printout)
- TRI Toxics Tracker: Potential Harm section
Example: Top Chemicals by Quantity vs. by RSEI Hazard
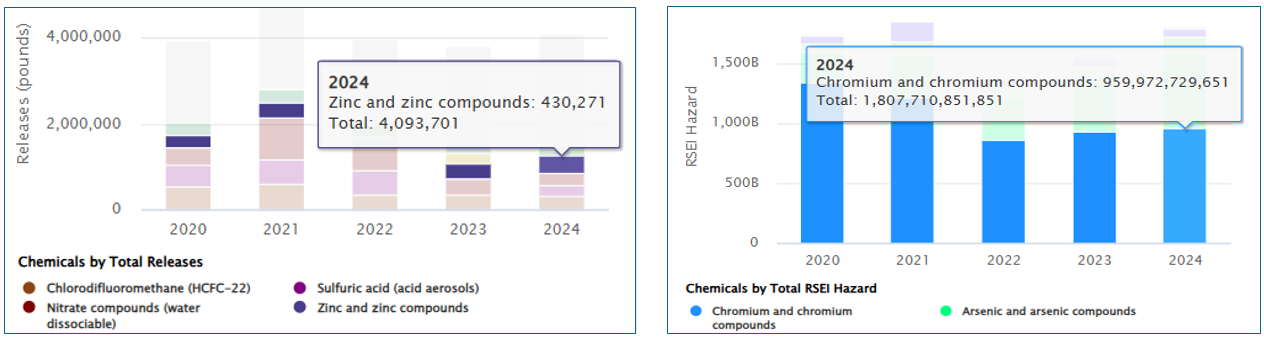
The chemicals that are released in the largest amounts are not always the ones with the top RSEI Hazard values. In this example, in 2024, the top chemical based on quantity is zinc and zinc compounds (first bar chart). However, chromium and chromium compounds are driving the RSEI Hazard value for Louisville (second bar chart), because they are relatively more toxic than zinc and zinc compounds. In Louisville, it may be most beneficial to focus P2 efforts on chromium and chromium compounds and the facilities that manage these chemicals.
4. What are the sources of chemical releases?
After identifying the chemicals that may be having the greatest impacts on human health, you may want to identify the sources of these chemicals. One way to do this is to look at the Top Facilities by RSEI Hazard table in the TRI Community Profile. It will list the top five facilities in your ZIP code based on RSEI Hazard.
As you consider the sources of chemicals with high RSEI Hazard values, keep in mind that facilities that do not report to the TRI Program may also be releasing these chemicals.
Where to Find This Information
- Community Profile: Top Facilities by RSEI Hazard (page 3 of printout)
- TRI Toxics Tracker: Facilities Summary: Facilities List
Example: Identifying Top Facilities Based on Releases and RSEI Hazard
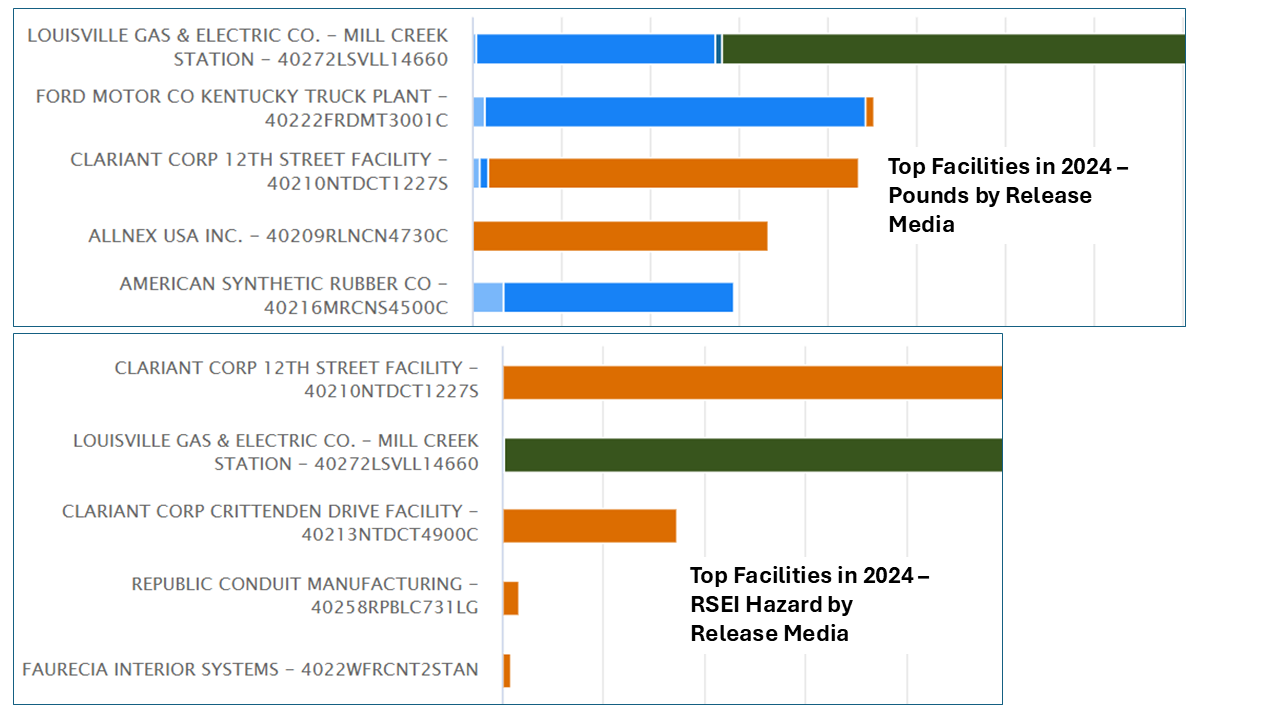
In 2024, the five facilities in Louisville that released the largest quantities of TRI chemicals are different from the five facilities with the highest RSEI Hazard values. The facility that released the largest amount of TRI chemicals is an electric utility that reported releasing a large amount of hydrochloric acid into the air. However, the facility with the highest RSEI Hazard value is a specialty chemical company that primarily reported off-site transfers of chromium and chromium compounds. EPA recommends analyzing both the quantity of releases and RSEI-modeled data to identify priorities for further investigation.
5. Who is potentially impacted?
The RSEI model can help identify sources of interest for communities wondering about potential impacts from toxic chemicals at nearby facilities. Generally, people who work at or live near industrial facilities are more likely to be exposed to toxic chemicals than people employed elsewhere or who live farther away from industrial areas.
Local environmental conditions, traditional economies, infrastructure, and cultural customs may also affect how chemical releases impact communities. For example, how close is your community to a highway? Does your community rely on subsistence fishing? Does the landscape surrounding your community cause warm air to trap pollution near the ground? Considering these and other aspects of your community along with TRI data can help to assess potential impacts from chemicals.
The TRI Community Profile and TRI Toxics Tracker include Census data that you may also want to consider, such as population density, unemployment rate, and percentages of individuals under 5 years old and over 64 years old.
Where to Find This Information
- Community Profile: TRI Summary and Top Facilities Lists (pages 1-3 of printout)
- TRI Toxics Tracker: Map of TRI Facilities
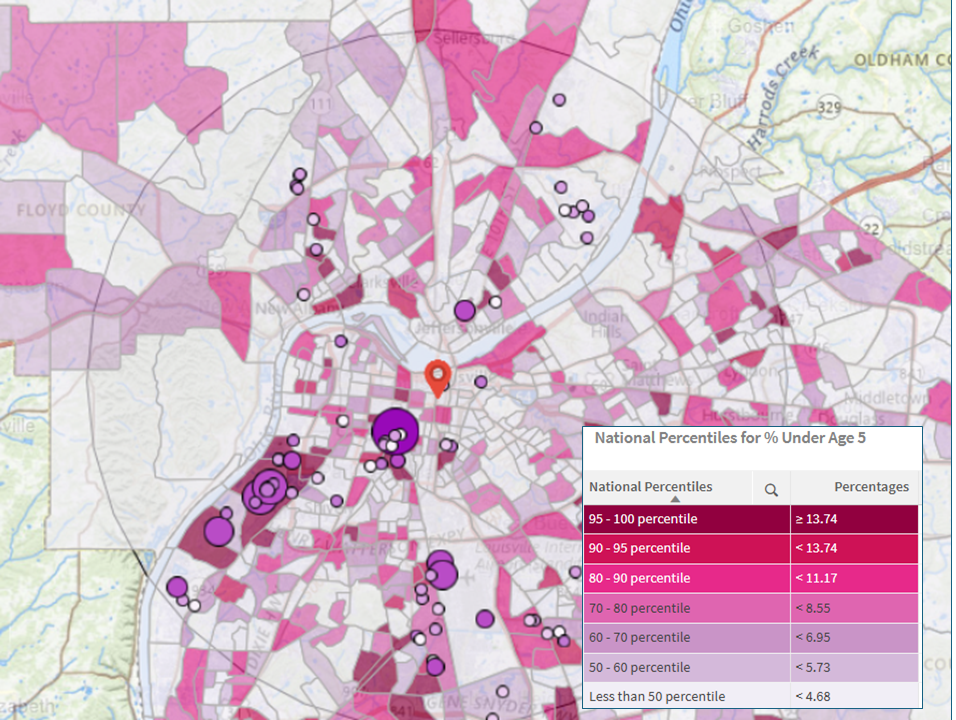
Example: Map of Facilities and Census Data for Louisville, KY
This map shows facility locations and Census data that give context about the surrounding communities. In this Louisville example, one of the facilities releasing the largest amount of chemicals is adjacent to several Census blocks with a higher percentage of children under 5 years old than in most of the U.S.
6. What are the trends in chemical releases over time?
Because TRI data are reported annually to EPA, you can track a facility's releases from year to year. Looking at how chemical release amounts have changed over time can help you determine if recent release amounts or RSEI Hazard values are typical for your community. Communities with historically high releases or high RSEI Hazard values may also have a legacy of pollution.
Changes in releases can occur for various reasons, such as modifications to TRI reporting requirements by EPA or changes in processes at individual facilities. A large decrease in release quantities or RESEI Hazard value could indicate that a facility has already implemented some P2 actions.
Where to Find This Information
- Community Profile: Trends in Releases and RSEI Hazard (page 1 of printout)
- TRI Toxics Tracker: Releases and Potential Harm sections
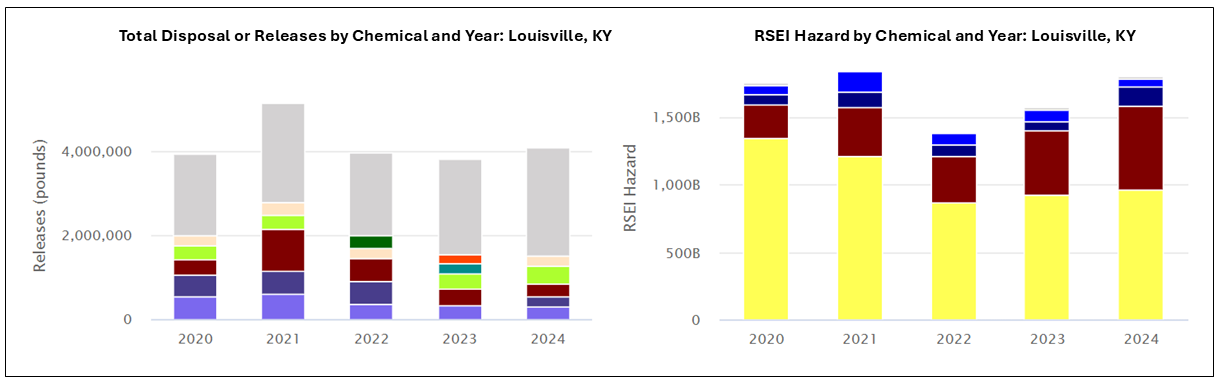
Example: 5-Year Chemical Trends in Louisville, KY
The first graph shows a slight increase in releases from 2020 to 2024. The RSEI Hazard graph also shows a slight increase during this time. Although the total RSEI Hazard value didn't change much, the portion of the hazard value coming from chromium and chromium compounds decreased, while the portion coming from arsenic and arsenic compounds increased. You can look closer at the data in TRI Toxics Tracker to identify the facilities responsible for these changes.
7. How do local facilities compare to each other? To facilities elsewhere? To other facilities in the same sector?
It may be helpful to compare the TRI data for two or more facilities in your community. You can also compare local facilities' TRI data for other facilities in the same industry sector located outside of your community. These comparisons will help you determine:
- if the chemicals and waste management methods a facility uses are typical for that industry sector,
- if the amounts released, recycled, treated, and burned for energy recovery are typical for that industry sector,
- where there may be opportunities to reduce chemical use at a local facility.
You can use the TRI P2 Search Tool to see a side-by-side comparison of a facility's chemical releases and the total releases for the rest of that industry sector, as shown in the pie graphs below.
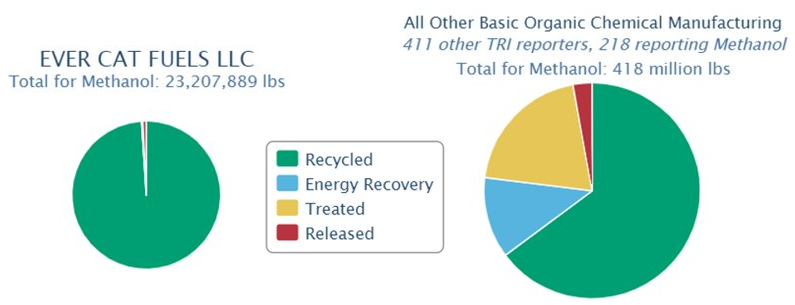
You can also compare the total release amounts and RSEI Hazard values in your community to those in other parts of your state or the country, as shown in the pop-up example below.
Where to Find This Information
- Community Profile: Summary of RSEI Hazard (page 3 of printout)
- TRI Toxics Tracker: Facilities Summary: Facility List
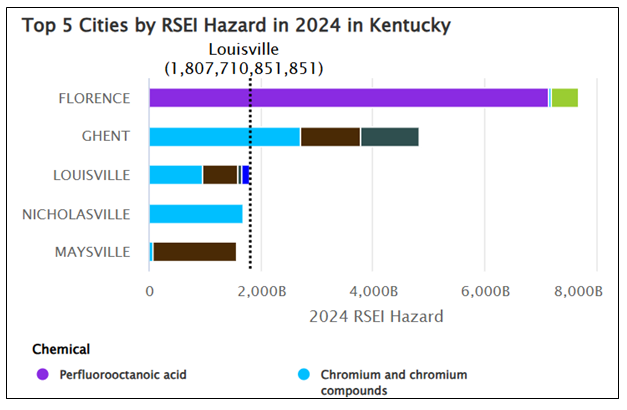
Example: Comparing Louisville to Other Cities in Kentucky
You can compare RSEI Hazard values in your community with other communities in your state to better understand how your community ranks in relation to others. In this example, the top five cities in Kentucky based on RSEI Hazard for 2024 are shown. Louisville ranks third in the state, with its RSEI Hazard value driven largely by off-site transfers of chromium and chromium compounds. Chromium-6 is a known human carcinogen.
Step 3: Identify Potential Solutions
Once you’ve identified the facilities, chemicals, or industry sectors that you want to focus on, you can begin to identify and evaluate opportunities to reduce chemical pollution.
1. Check if local facilities have implemented pollution prevention
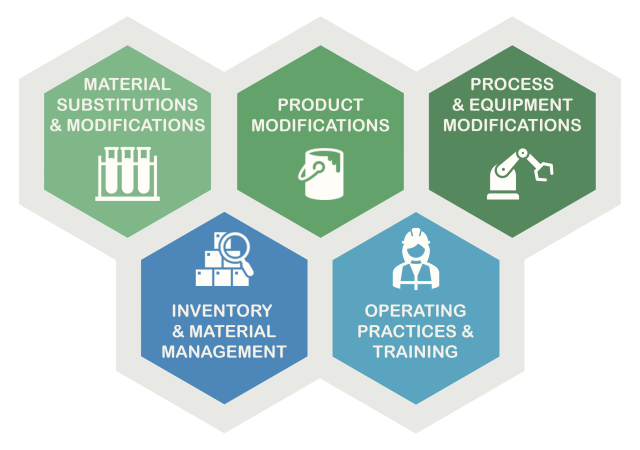
P2 activities, also known as "source reduction," reduce, eliminate, or prevent the creation of pollution. Facilities that implement new P2 activities involving TRI-covered chemicals must report them to the TRI Program. Examples of P2 activities include:
- changing one or more materials used in a process so it creates less pollution or is less harmful to health or the environment,
- changing the processes or equipment used at a facility to create less waste, or using chemicals that are less hazardous,
- managing supplies and handling materials to prevent spills, leaks, and waste.
You can review a facility’s reported P2 activities and see the impact they've had on the amount of chemical waste managed at the facility. If a facility reported few or no P2 activities, it could benefit from P2 technical assistance. Similarly, if a facility’s P2 activities have had a limited effect on the amount of chemical waste it manages, it be may a candidate for P2 technical assistance.
TRI P2 information can help identify where technical assistance would be most beneficial to facilities and the communities around them, such as facilities releasing large amounts of chemicals near vulnerable populations.
Where to Find This Information
- Community Profile: Summary of Releases: Top Facilities (page 2 of printout)
- TRI Toxics Tracker: Facilities Summary: Facilities List
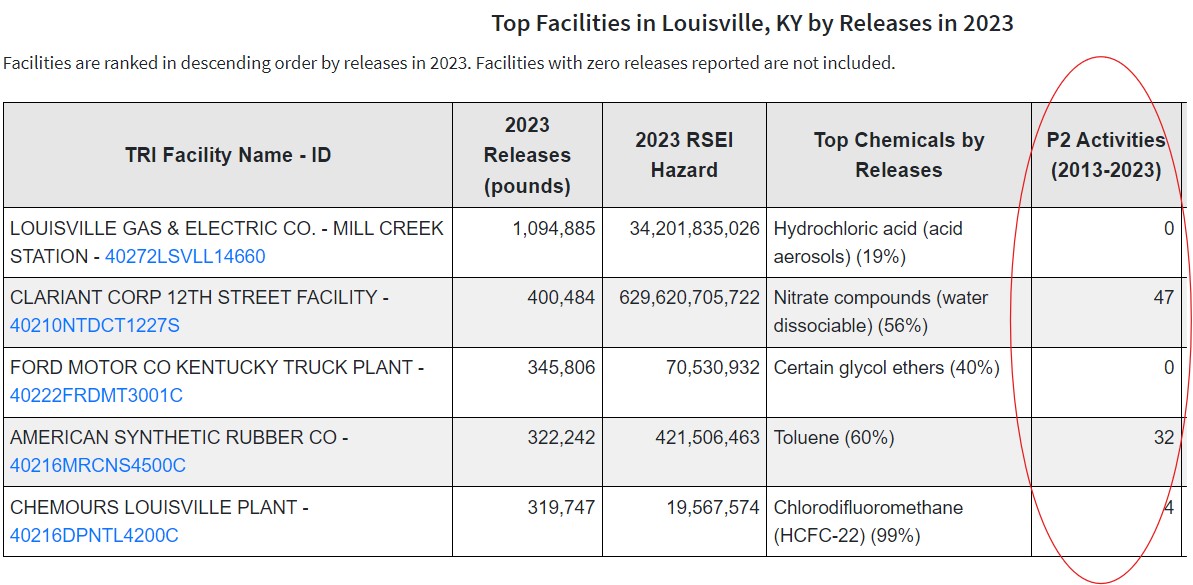
Example: Have Facilities Implemented Any P2?
The 'P2 Activities' column within the 'Top Facilities' table indicates how many P2 activities the top-releasing facilities reported implementing in the past 10 years. If a facility reported few or no P2 activities, it could benefit from P2 technical assistance.
2. See what P2 methods have been effective at other facilities
You can look at facilities in the same industry sector as one you are concerned about to learn what P2 activities have been most effective at reducing chemical releases. You can also look across industry sectors to learn how other facilities have successfully reduced releases of a particular chemical.
Note that industrial facilities often have multiple P2 options that vary in effectiveness. They may implement more than one type of P2 activity because activities are frequently co-dependent. For example, a chemical substitution at a facility may require a process change and then additional training for employees.
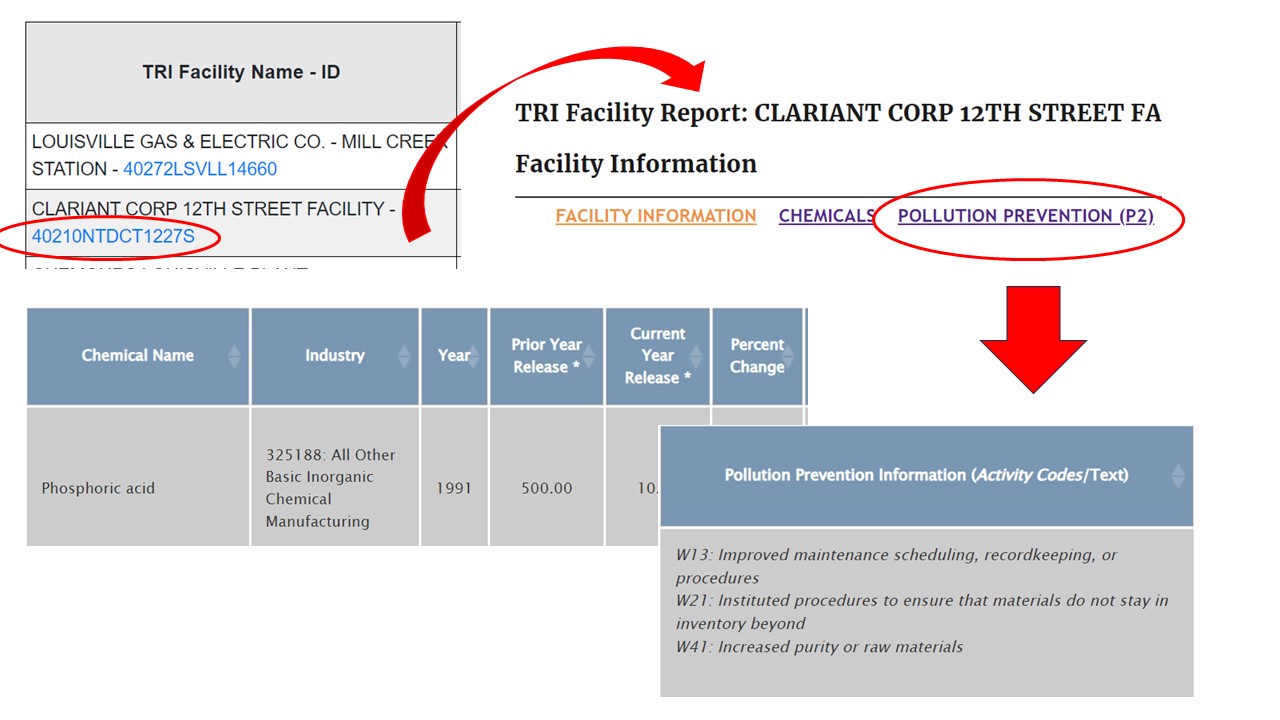
Once you’ve determined which local facilities have implemented P2, you can review their TRI P2 information. Facilities are required to report codes that describe their P2 activities. Some choose to give additional details such as the names of chemical substitutes, descriptions of process changes, and changes to their purchasing practices. This extra information can help assess the effectiveness of the P2 activities and the potential for other facilities to replicate them.
You can access a facility’s reported P2 information through the Community Profile: in the Facility Name column of the Top Facilities table, click on the blue hyperlinked TRI Facility ID number to go to the facility’s Envirofacts TRI Facility Report. Then click on the Pollution Prevention tab.
Where to Find This Information
- Community Profile: Summary of Releases: Top Facilities (page 2 of printout)
- TRI Toxics Tracker: Pollution Prevention section
Example: Reviewing a Facility's P2 Information
By clicking on a TRI Facility ID number within the Community Profile, you can get to a facility's full Envirofacts Facility Report. One section of the report shows P2 information for each chemical for which the facility reported. This includes required source reduction codes and any optional text the facility chose to include.
3. Gather facility-specific information
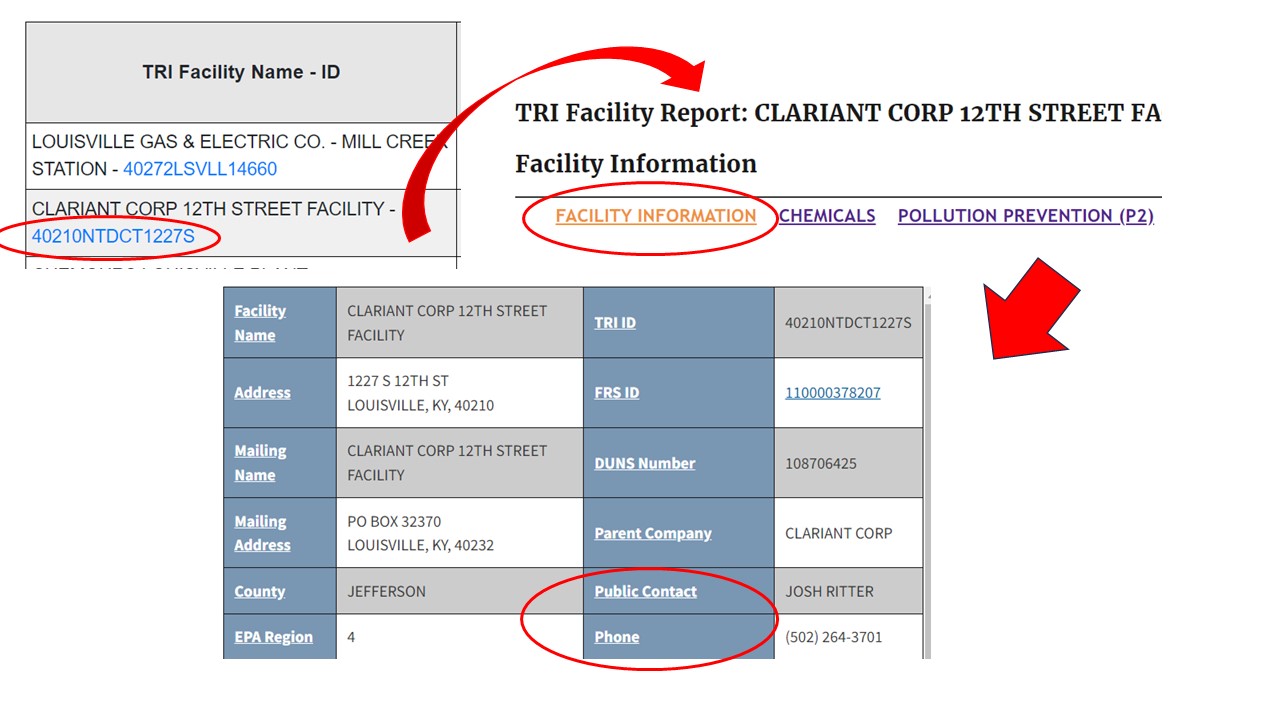
Each facility that reports to TRI must designate a company representative to respond to questions from the public. You can contact this person to learn more about the facility's TRI data, including its P2 activities. You can find facility contact information in Part I, Section 4.4 of the TRI reporting form. It’s also visible within the Facility Information tab of the Facility Report from the previous step. See the What You Can Do webpage for examples of questions to ask facility representatives.
You may also want to review other details about the facility such as its enforcement and compliance data. In EPA’s Enforcement and Compliance History Online (ECHO), you can see when the facility was last inspected, if the facility has a history of complying with environmental permits and other regulatory requirements, and other details. Note that most search results from online TRI tools include direct links to facility-specific ECHO reports.
Where to Find This Information
- Community Profile: Summary of Releases: Top Facilities (page 2 of printout)
- TRI Toxics Tracker: Facilities Summary: Facility List
Example: Find a Facility's Contact Information
By clicking on a TRI Facility ID number within the Community Profile, you can get to a facility's full Envirofacts Facility Report. The facility's designated public contact's name and phone number is found in the table within the first section of the report.
4. Research P2 opportunities beyond TRI
While the TRI Program has collected information about P2 activities since 1991, other resources may contain more detailed, transferrable information about technologies, process enhancements, and other actions industrial facilities have taken to reduce pollution. Learning about specific P2 actions or projects can help you find out what was successful or unsuccessful in other approaches.
Consult EPA resources such as:
- P2 Hub Resources Center: Browse case studies or learn about safer alternative chemicals or technologies that could be solutions for addressing community concerns.
- Safer Choice Program: Learn about options for safer chemicals to use in processes and products.
5. Find opportunities to participate in regulatory processes
Facilities that report to the TRI are typically larger facilities with multiple environmental permits that go through routine permit renewal processes. There are usually opportunities for concerned citizens to participate in these processes, which can help encourage facilities to implement P2 practices.
You may want to stay informed of scheduled public comment opportunities during facility permitting processes or other environmental decision-making processes. These opportunities are often announced in local news media, posted on local government webpages, or tracked in the Federal Register.
Being aware of facilities’ regulatory obligations and permit renewal cycles can give community members time to prepare to share local knowledge and concerns with decision makers. Community members may be able to influence a facility’s emission limits, monitoring schedules, pollution control technologies or P2 plans.
6. Explore opportunities for facility technical assistance
In many locations, facilities have access to resources to help them identify and implement P2 solutions. Local and state agencies, such as environmental protection and public health departments, often provide technical assistance and track available opportunities. Some universities also support industrial facilities through P2 programs.
Facilities may be unaware that these technical assistance resources exist or may not be taking full advantage of them. If your community is concerned about specific facilities, you may want to contact them (see Gather Facility-Specific Information above) to ensure that facility managers know about available technical assistance.
Step 4: Act to Advance Solutions
Once you have identified and evaluated potential solutions for reducing local chemical pollution, you and others in your community may want to encourage facilities to implement them. The following steps can help.
1. Prioritize concerns and opportunities for improvement
If you’re not sure which solution to work on first, start by prioritizing the options based on the top environmental or human health concerns in your community. You can use screening-level tools like the RSEI model or rank facilities based on release quantities to help you.
2. Ask for help
EPA, other government agencies, technical assistance programs, and organizations in your community can suggest ways to work with local facilities to reduce toxic chemical releases. You may want to refer to:
- State Health and Environmental Agencies: EPA's list of state organizations that can help address local concerns.
- What You Can Do with the TRI: Examples of what you can do with the TRI data you find and contacts for additional assistance.
3. Collaborate with local groups and stakeholders
Consider collaborating with non-governmental organizations (NGOs), local community groups, and technical assistance providers to research and propose solutions during routine environmental regulatory processes or other public participation opportunities. Identify regional, state, and local technical assistance groups on EPA’s Technical Assistance Providers page.
4. Leverage technical assistance
EPA’s P2 Grant Program provides funding to help businesses develop and implement source reduction practices. P2 grants are awarded to state agencies and state-affiliated colleges and universities. Individuals and community groups may be able to work with TAPs or other groups with expertise in implementing P2 programs to assist eligible awardees or to increase awareness of available funding and assistance.
5. Look for financing opportunities
In addition to grant opportunities, EPA hosts a P2 Financing webpage with tips for securing funding or P2 projects and an overview of available funding sources for P2 activities. The U.S. Small Business Administration also has grant opportunities for community organizations. For more information, see their grants for community organizations webpage.