Measuring the Impact of Source Reduction
For decades, manufacturers have been implementing projects to eliminate or reduce the creation of chemical waste. Annually, certain manufacturing facilities report these projects, known as “source reduction” activities, to the Toxics Release Inventory (TRI).
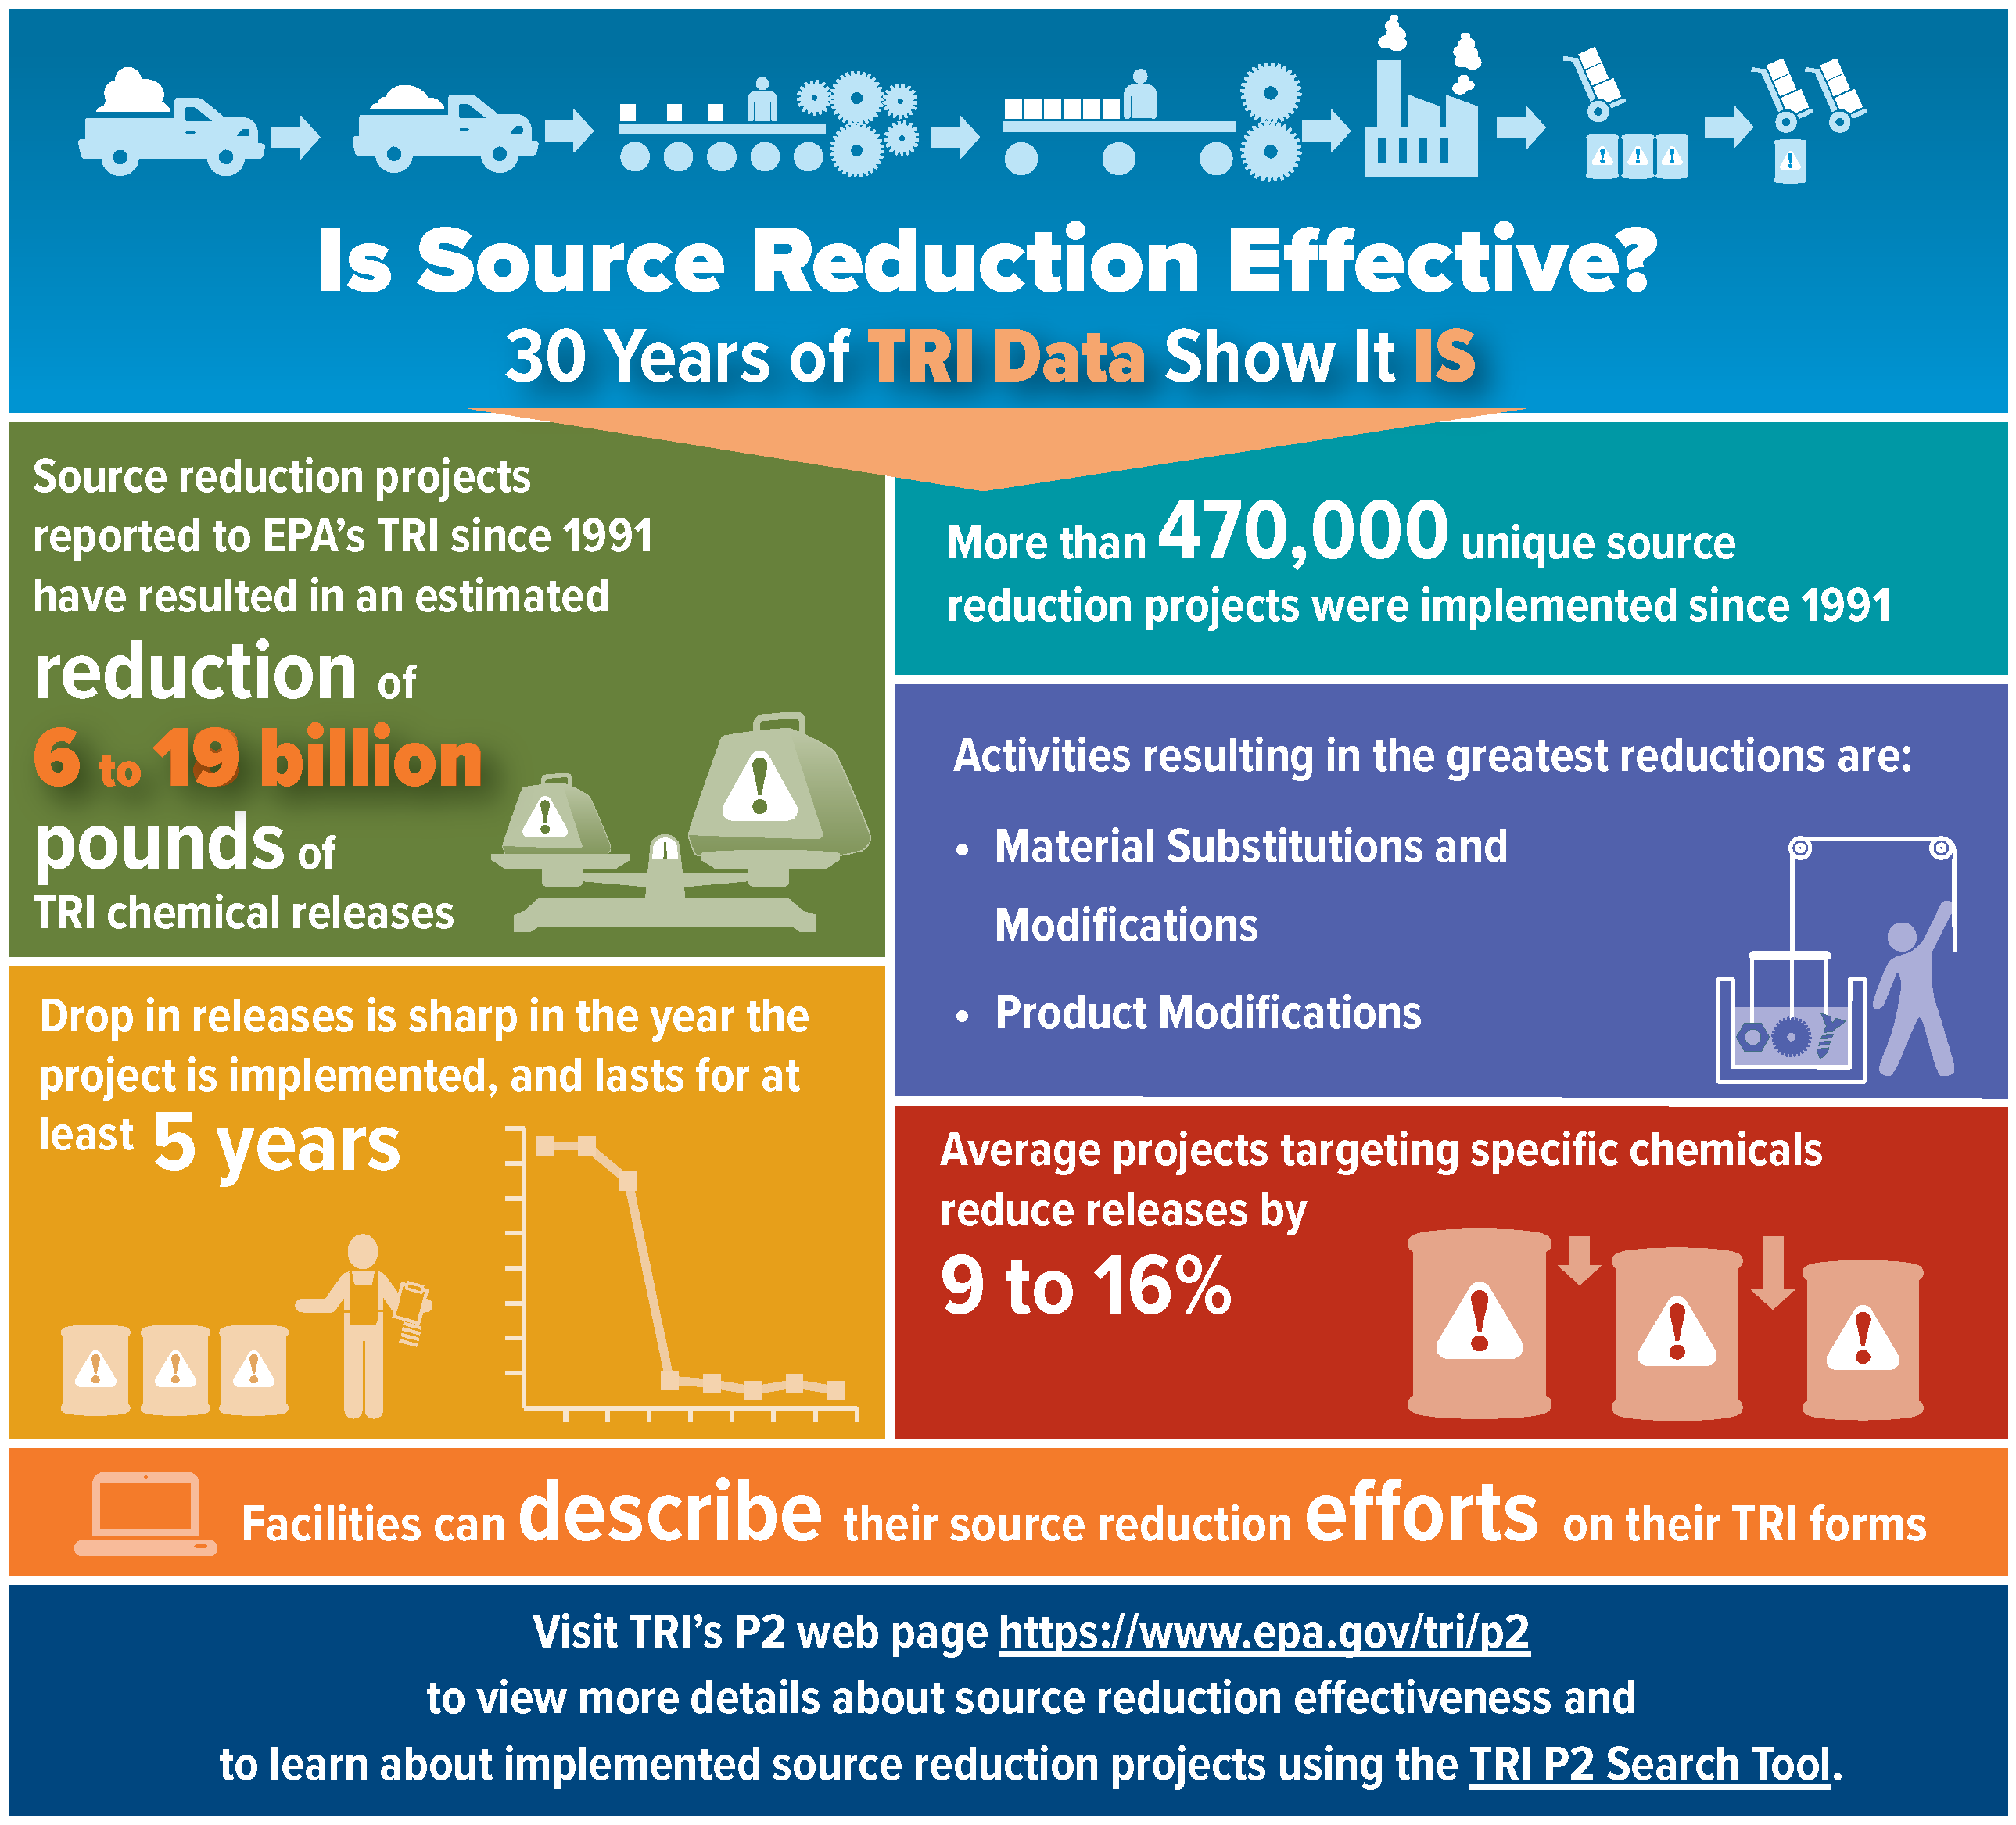
Source reduction is the practice of reducing the quantity or toxicity of waste generated prior to recycling, treatment or disposal, by changing the processes that generate pollution in the first place.
From 1991 to 2021, more than 23,000 industrial facilities reported implementing 470,000 unique source reduction activities. During this time period, TRI chemical releases declined fairly steadily. How did facilities collectively achieve this reduction in releases and how much of it can be attributed to source reduction activities? EPA looked closer at the data to find out.
To quantify the contribution of source reduction projects to reduced chemical releases, EPA's analysis accounted for other factors—changes in the types of goods manufactured in the United States; outsourcing of manufacturing; changes in economic output; and passage of federal, state, and local pollution regulations—that would have influenced releases, even if facilities had not implemented source reduction.
Using a “differences-in-differences” is a statistical technique commonly used to measure how an outcome variable changes (in this case, TRI releases) in the group that receives the intervention (i.e., those implementing P2), and in a similar group that does not receive the intervention (i.e., no P2 implementation). The difference between these two groups is then interpreted as the causal effect of the intervention (i.e., the effect of P2 implementation on releases), accounting for all other factors (e.g., changes in production) that would have changed releases anyway even if P2 was not implemented. approach to control for these factors, EPA assessed more than 30 years of TRI data on source reduction projects. Results of the analysis were originally published in Environmental Science and Technology in 2015 and are updated and summarized here.
Toxic chemical releases decrease after the implementation of a source reduction project.
Results of the analysis show that the average source reduction project causes a 9% to 16% decrease in chemical releases in the year the project is implemented. Consideration of the individual source reduction categories shows that the effects of a project vary based on the technique implemented. Of the five categories, those focused on Material Substitutions and Modifications, and Product Modifications result in the largest first-year decreases in releases, with declines of 20%, and 12%, respectively. The graphs below show that in the years before a project is implemented, release quantities are approximately flat. Then, in the year of implementation (labeled “year 0” on the graphs below), reported release quantities drop sharply and substantially. Releases continue to fall during the following year, with the decline lasting for at least five years before leveling out.
This analysis also estimated the collective impact of these 470,000 source reduction projects in terms of the quantity of chemical releases prevented by facilities. EPA estimates that source reduction eliminated 6 to 19 billion pounds of chemical releases between 1991 and 2021. The graph below illustrates this cumulative effect of source reduction based on four different approaches. While these estimates span a wide range of results and have important caveats, they indicate that source reduction has been an effective tool for reducing chemical releases at industrial facilities that report to the TRI Program.
TRI Source Reduction Information
- To report your facility’s newly implemented source reduction projects, refer to the P2 Reporting Guide and the P2 Reporting Tip Sheet (pdf).
- To view specific source reduction projects reported to TRI, use the TRI P2 Search Tool.