
About the Data
EnviroAtlas provides data at the U.S. national extent and at higher resolution for selected populated places.
- Most maps at the national extent provide wall-to-wall data coverage for the contiguous U.S. as well as some data for Alaska, Hawaii, Puerto Rico, the U.S. Virgin Islands, American Samoa, Guam, and the Commonwealth of the Northern Mariana Islands .
- Finer-scale data for selected populated places in EnviroAtlas draw from meter scale urban land cover data, census data, and models.
- Explore all EnviroAtlas data layers in the Dynamic Data Matrix.
- Learn more about our approach to data development.
National Data
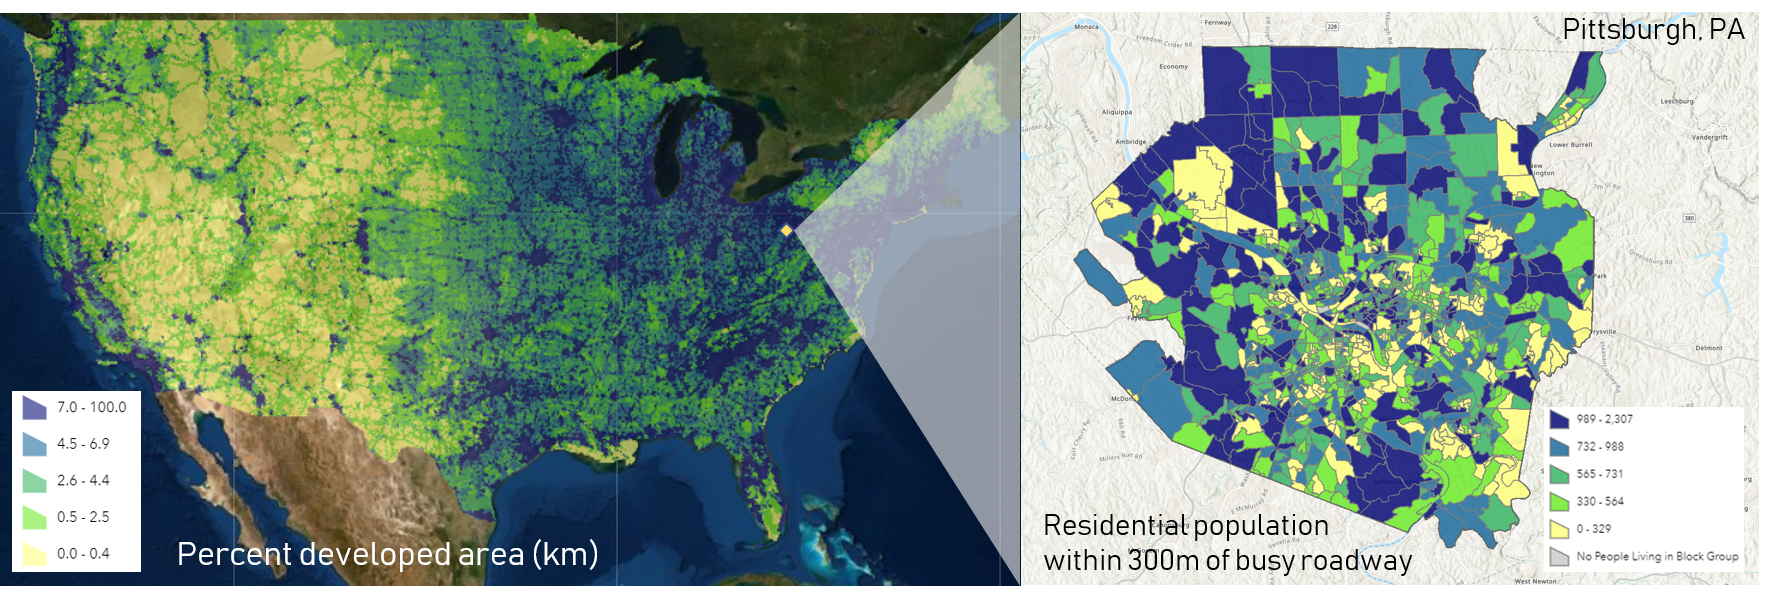
- Most maps at the national extent provide wall-to-wall data coverage for the contiguous U.S. as well as some data for Alaska, Hawaii, Puerto Rico, the U.S. Virgin Islands, American Samoa, Guam, and the Commonwealth of the Northern Mariana Islands. There are over 400 data layers at this extent.
- Many of these data layers are summarized by 12-digit hydrologic unit codes (12-digit HUCs), or sub-watershed basins, and provide approximately 90,000 similarly sized spatial units. Many of these data layers are derived from data with a resolution of 30 m.
- Ecosystem Markets data layers are available for the nation, showing point and polygon data for ecosystem market initiatives and enabling conditions operating at a variety of scales, from national to local.
Populated Places at High Resolution
- Higher resolution data in EnviroAtlas draws from meter scale urban land cover data, census data, and models. There are approximately 100 data layers per area.
- These fine-scale data are consistent for each available populated place, and they are mostly summarized by census block groups.
- Many of the boundaries for community areas are based on selected block groups within the 2010 US Census Urban Area boundary.
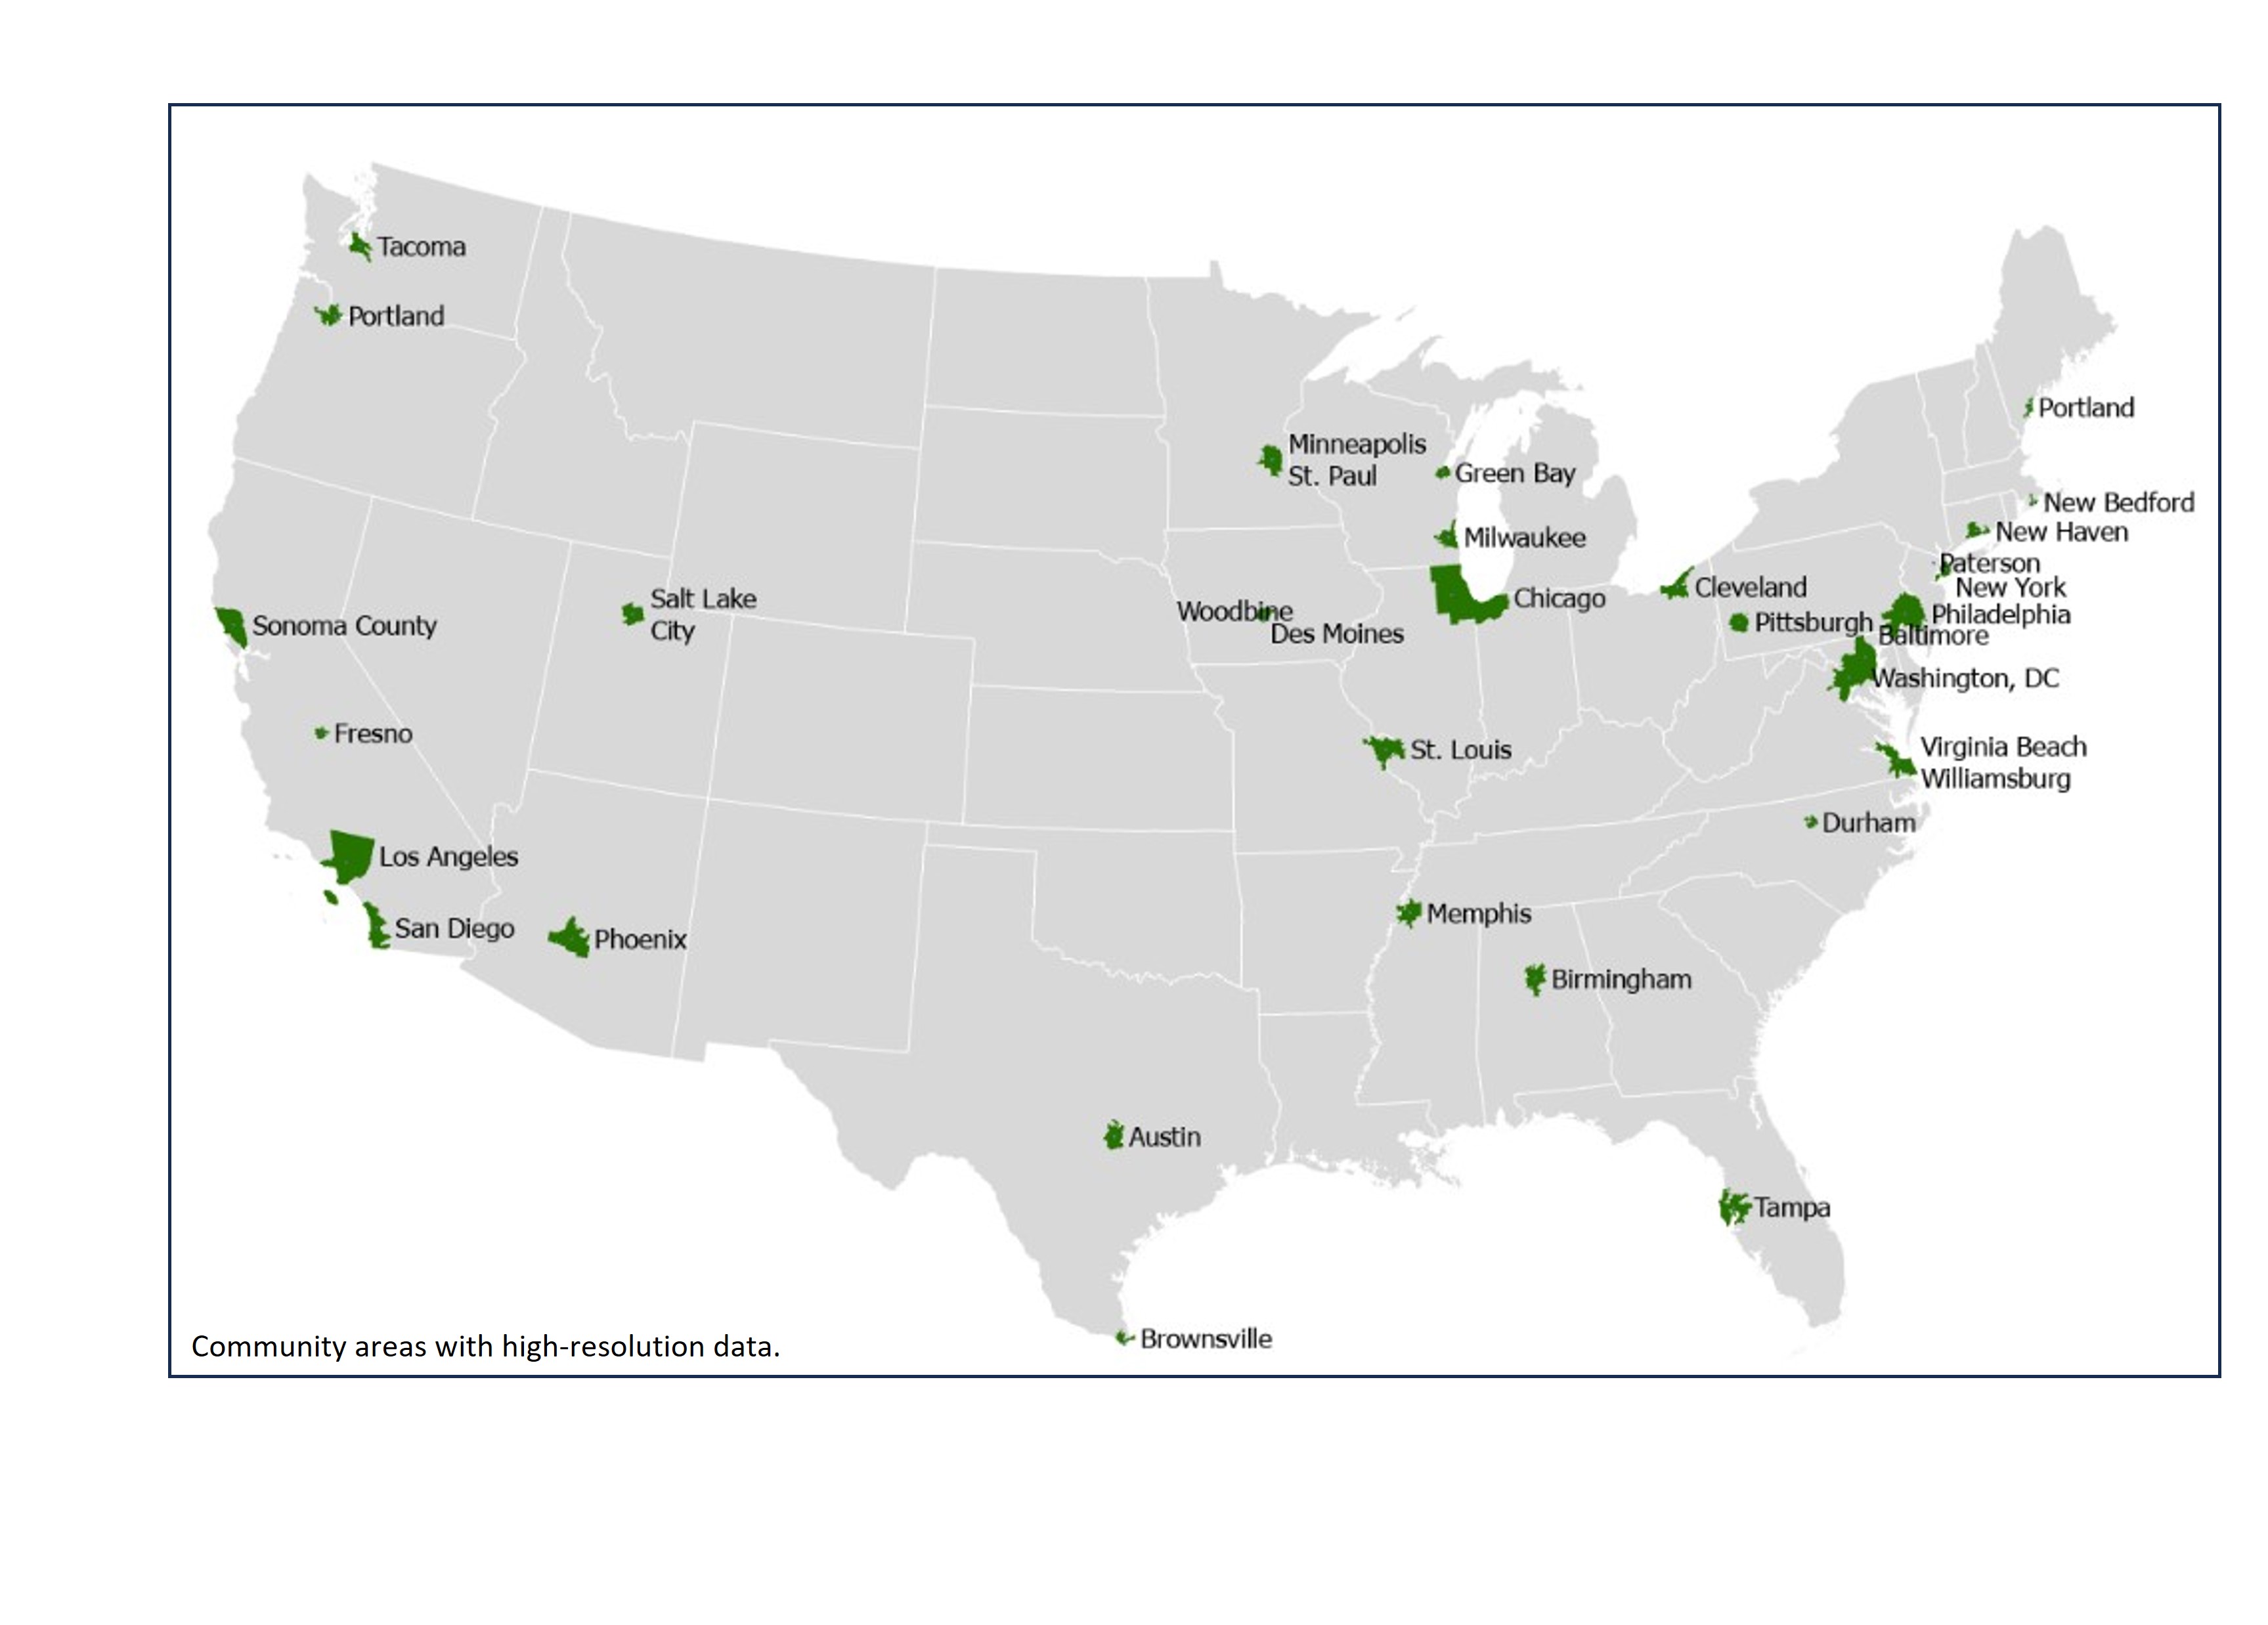
- EnviroAtlas currently includes fine-scale data for more than 1400 cities and towns centered on 30 U.S. urbanized community areas (shown in the map below). See a list of the municipalities that have available high-resolution data.
These areas were selected based on:
- geography,
- ongoing local research,
- data availability,
- and opportunities to leverage other EPA projects.
EnviroAtlas Uses an Indicator and Index Approach to Ecosystem Services
- We select and develop indicators for their ability to provide information about a particular ecosystem service.
- Many of the indicators are not a direct measurement of a specific ecosystem service but rather provide one piece of a complex puzzle of information.
- Indicators have been selected for their ability to describe provision, benefits and beneficiaries, and drivers of change of ecosystem services.
- Some of the community data gets closer to ecosystem services measurements than does the national data because models have been developed that can be applied at the community scale.
- Taken collectively, a group of indicators can get closer to accurately quantifying an ecosystem service. EnviroAtlas is adding tools allowing the user to take a group of indicators and combine them into an index.
- The EnviroAtlas team is continuing to develop more robust indicators.
EnviroAtlas Relies on Foundational Data
The development of indicators relies on the availability of nationally and locally available data sets which provide inputs to models and calculations.
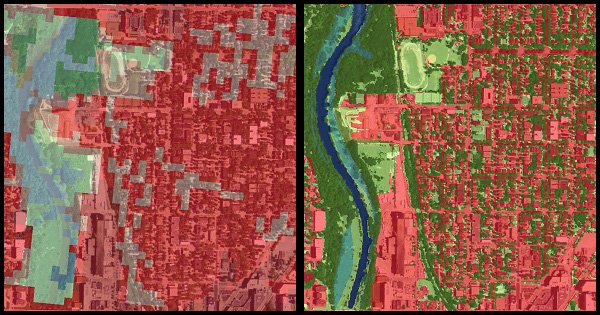
In downtown Milwaukee, WI (1:6000), the 30m NLCD dataset (left) presents a coarse, pixelated picture with a majority of developed (red) land cover. By contrast, the 1m EnviroAtlas community data (right) provides a clearer picture that reveals more natural land cover, such as water (blue) and trees (dark green). EnviroAtlas supports the development of some data sets that provide important inputs. - Land cover, for example, is a critical data set that is necessary for the computation of many of the EnviroAtlas data layers.
- EnviroAtlas supports the development of the National Land Cover Dataset (NLCD)EXIT, a 30 meter resolution product.
- We also develop the high resolution land cover, a 1 meter resolution product, that is used for the selected communities.
- NLCD is produced annually.
- For investigating changes over time, it is important to have land cover data available for multiple time periods.
- Other data sets such as stream hydrography, soils, demographics, topography, and economic data, in combination with land cover, are used to produce our indicators.