


ExpoKids: Tools and Resources
On this page:
Tools
ExpoKids R (Downloadable R Code)
ExpoKids Version 1.0 is an R-based visualization tool that graphically illustrates estimates of relative exposure and aggregate exposure sources within and across lifestages. The R Code is available in the US EPA / ExpoKids repository on GitHub.
Learn more about using R from the ExpoKids user guide and in the Dai et al., 2020 JESEE article.
Example Graphs & Data Visualizations
ExpoKids can generate five different graph types from loaded data;
- Average Daily Dose (ADD) by lifestage
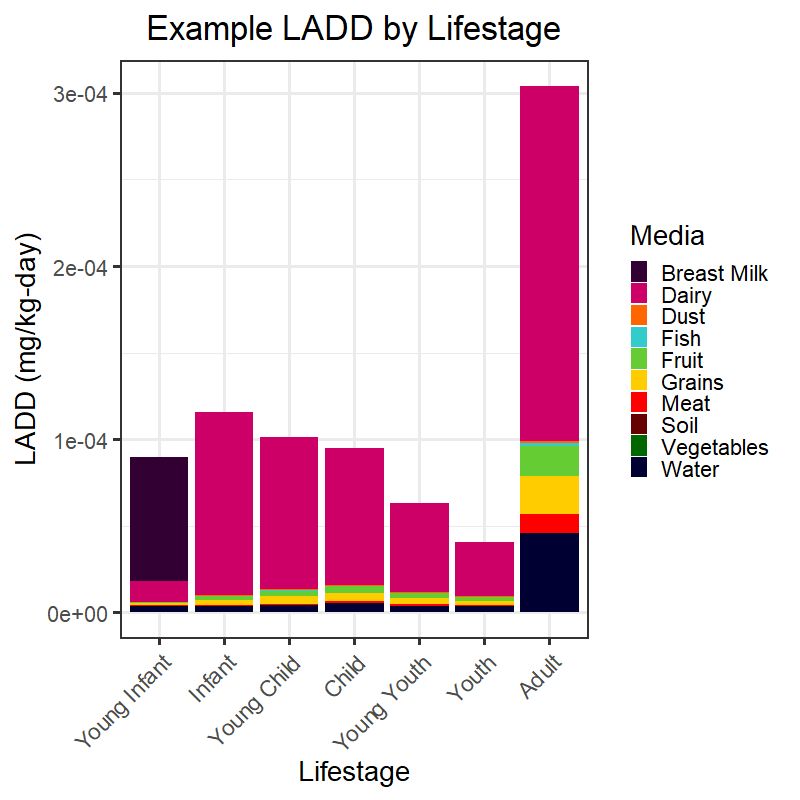
- Lifetime Average Daily Dose (LADD) by lifestage
- ADD for an individual exposure pathway by lifestage
- LADD for an individual exposure pathway by lifestage
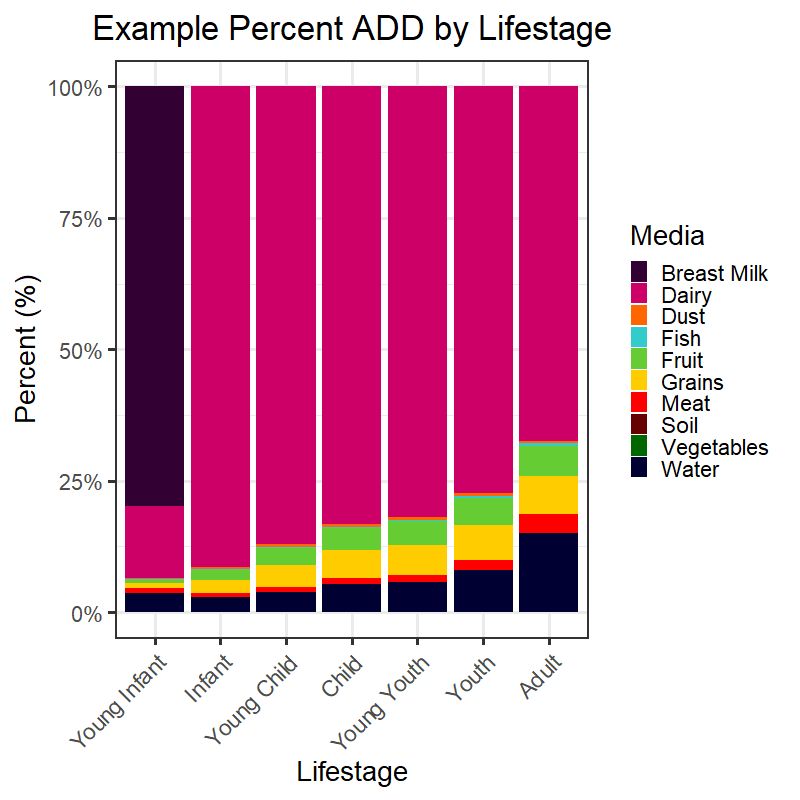
- Percent ADD by lifestage
See the following illustrations of output samples of ExpoKids graphs based on the list above and the sample data table from the Supplementary Information file (below):

|
|

|

|
| |
Resources
EPA Reports
Journal Articles
- ExpoKids: An R-Based Tool for Characterizing Aggregate Environmental Exposure During Childhood. M. Dai, S. Euling, L. Phillips, and G. Rice. JESEE, 2020. Available at: https://www.nature.com/articles/s41370-020-00265-6