Estuary Data Mapper (EDM) Release History
Refer to the dates of EDM releases for information on new or enhanced features and content.
- June 25, 2025
- March 3, 2025
- June 21, 2024
- May 20, 2024
- May 3, 2024
- August 24, 2022
- February 25, 2022
- November 23, 2021
- July 1, 2021
- December 7, 2020
June 25, 2025
- Updated Windows version of EDM with curl v8.14.
March 3, 2025
- New Puget Sound flowlines and discharge points data for RBEROST.
- Updated Aquarius satellite salinity data access.
- Added SMAP (Soil Moisture Active Passive) satellite daily and monthly salinity data.
- Updated NOAA HDM (Hydro-Dynamic Model) data access.
June 21, 2024
- Updated the Water Quality Portal (WQP) and Satellite menus with currently available variables.
May 20, 2024
- Added Updated Seagrass Retrieval in EDM information in Special Topics and Videos
May 3, 2024
The latest update to Estuary Data Mapper includes the following features:
- Added Enterococci and E.Coli water quality data
- Added SMAP (Soil Moisture Active Passive) satellite salinity 0.25-degree data (2015-present)
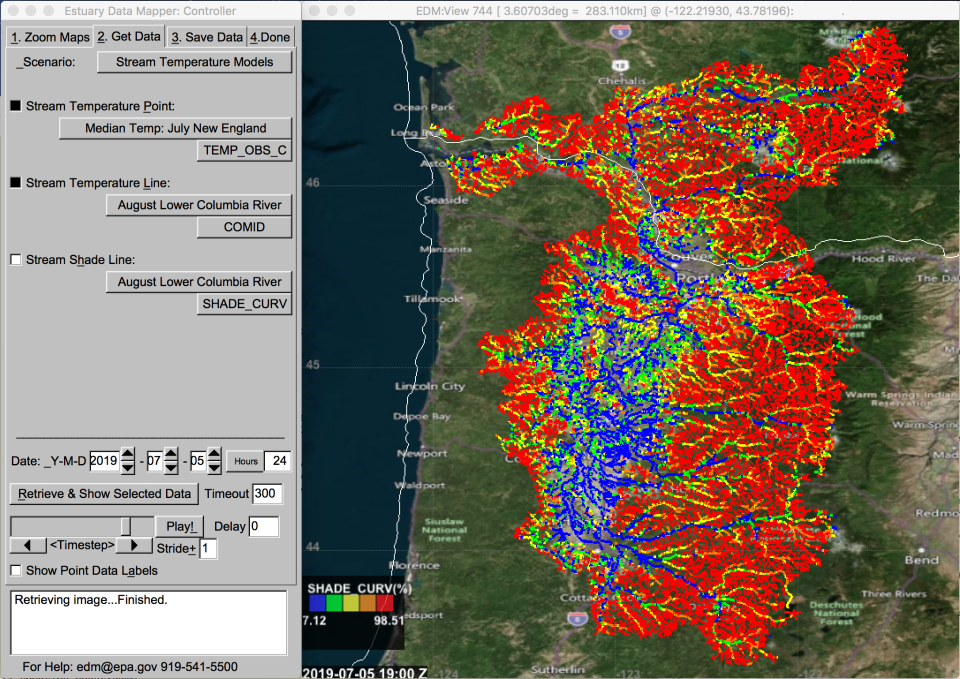
- Added stream temperature and shade data for the Columbia River
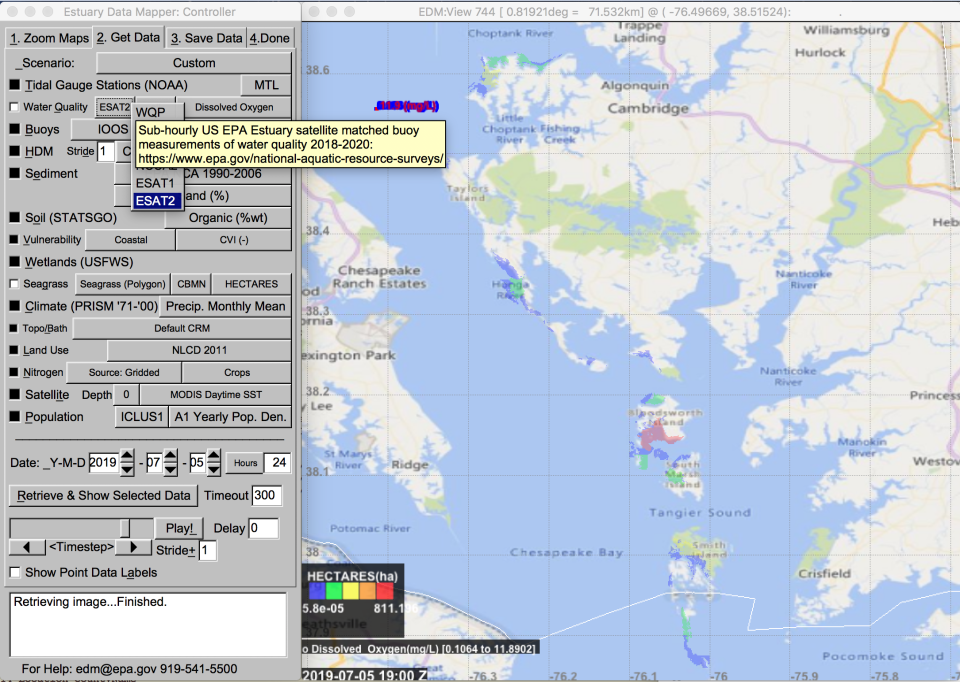
- Added ESAT1/2 water quality data
August 24, 2022
February 25, 2022
- Replaced the estuary_flushing/monthly/ffm csv files
- Replaced the latest xml files
- Enabled the Nutrient Sensitivity Scenario
November 23, 2021
- Water Quality: NCCA2 (2015)
- Sediment: EPA NCA 2015
- Seagrass Eelgrass (Polygon)
- Nitrogen: CMAQ grid (EQUATES 2002-2017
July 1, 2021
EDM updates: Estuarine characterization files (v2)
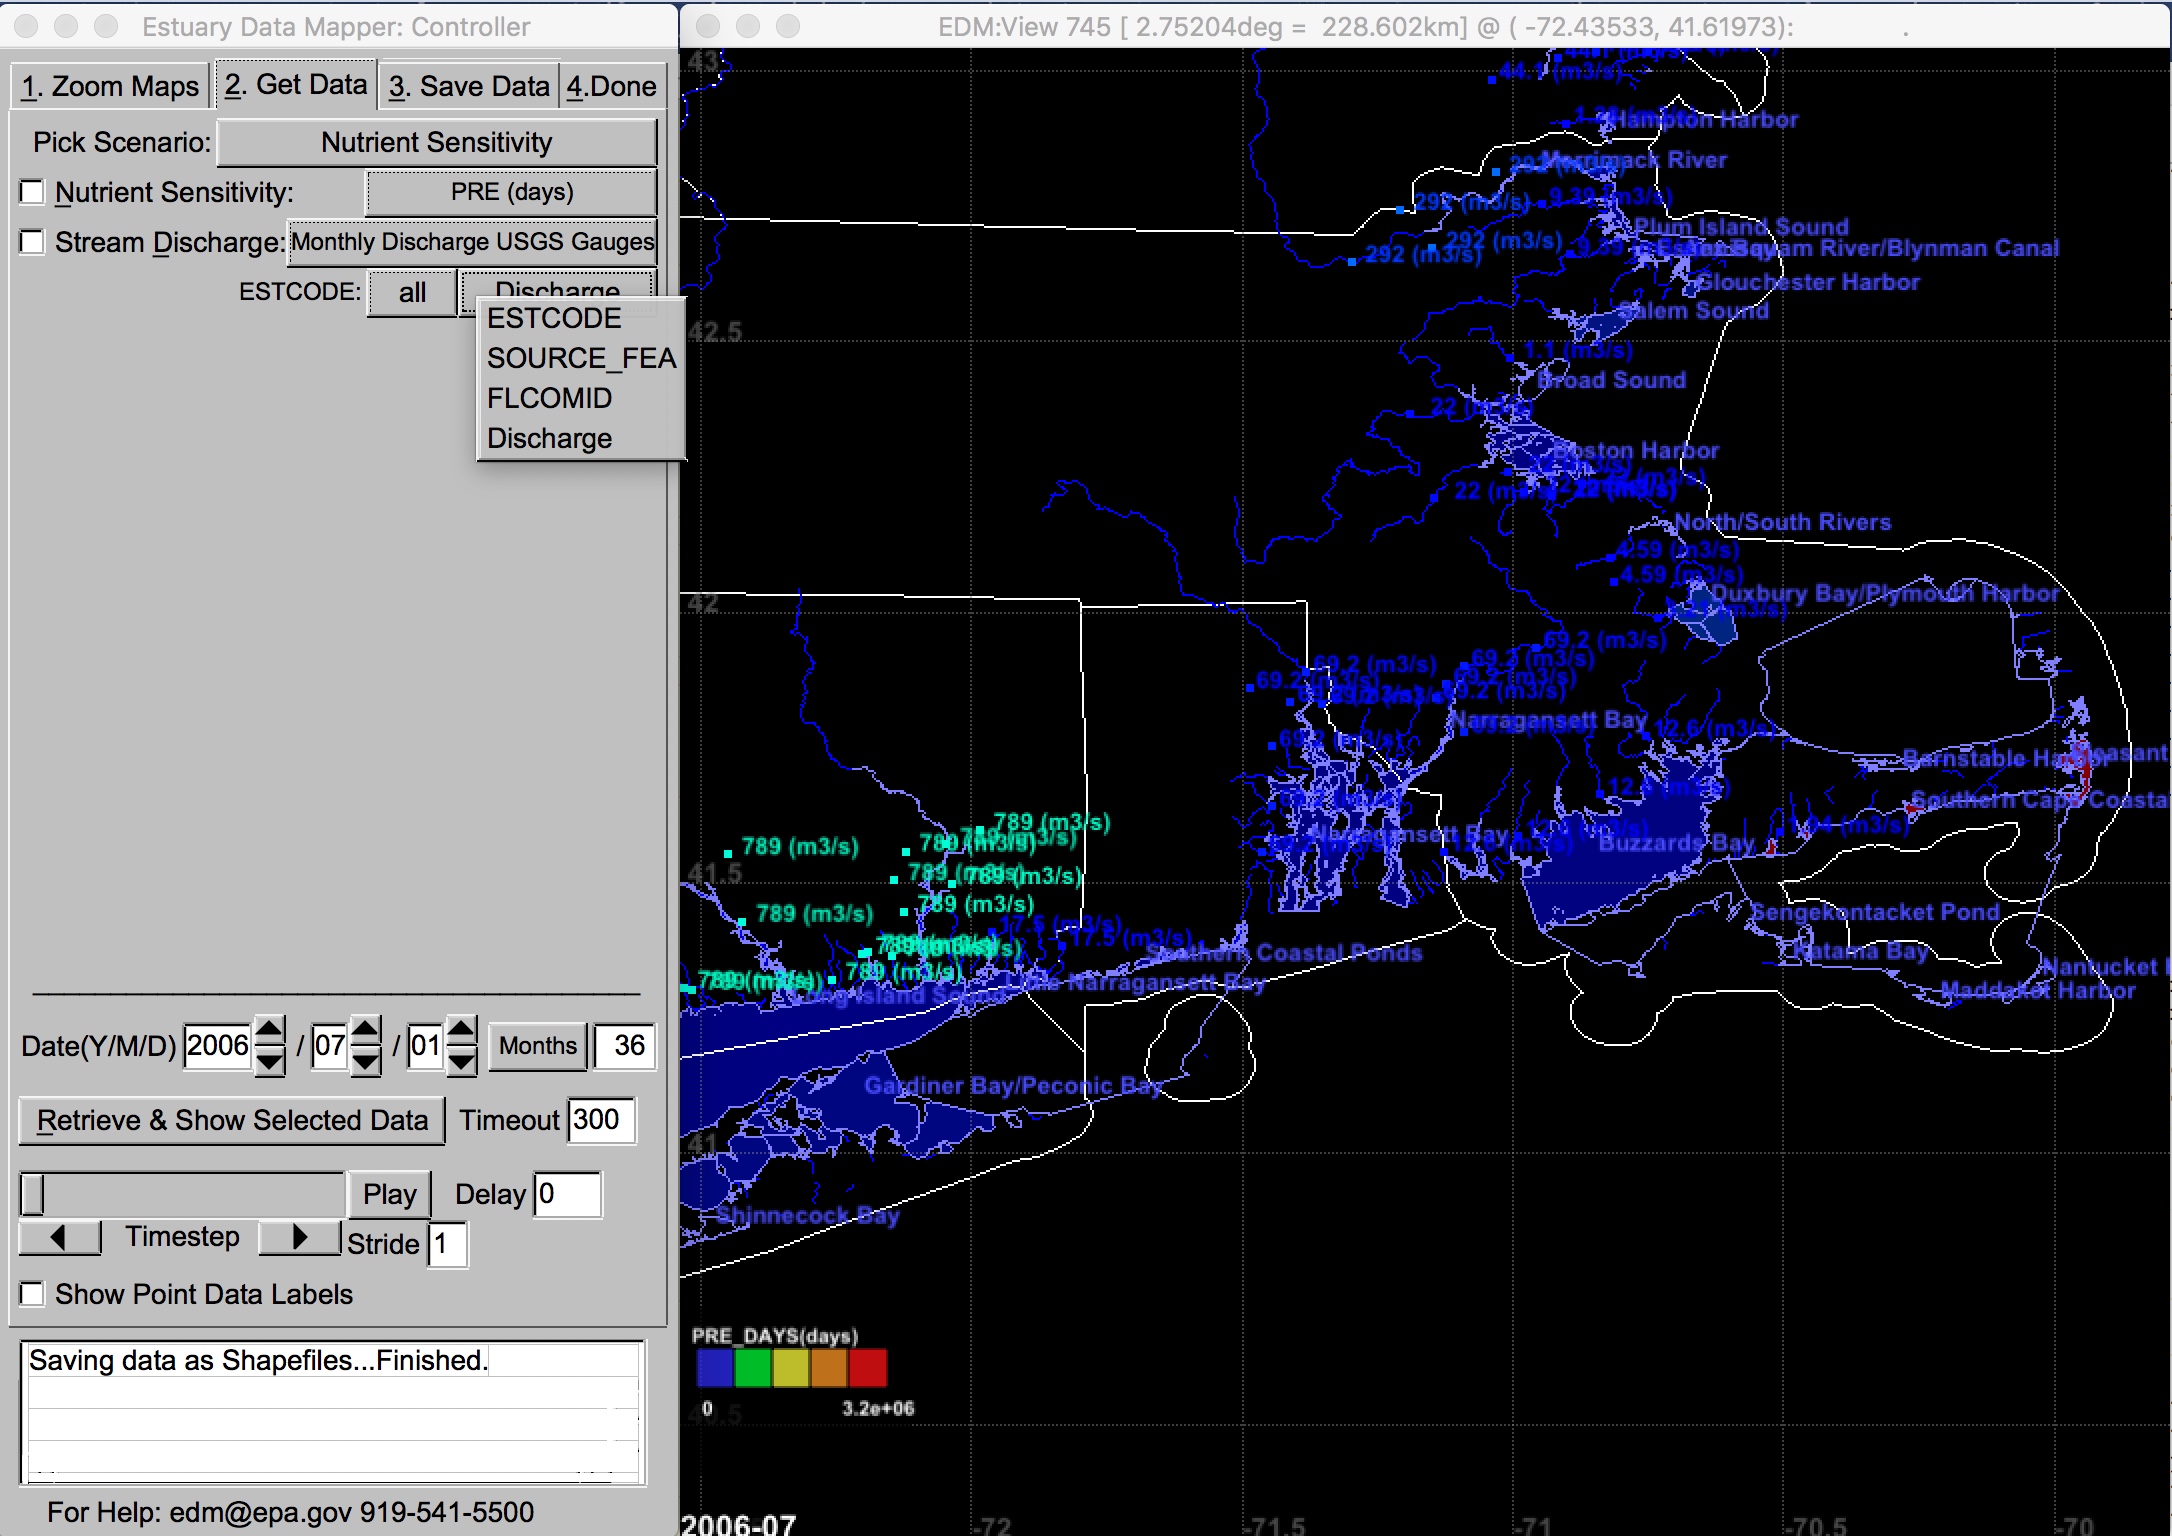
Variables related to the original EPA estuarine classification database (US EPA 2004) have been moved and now can be found in EDM within the Nutrient Sensitivity Scenario on the Get Data tab here (Nutrient Sensitivity button), as shown in Figure 1:
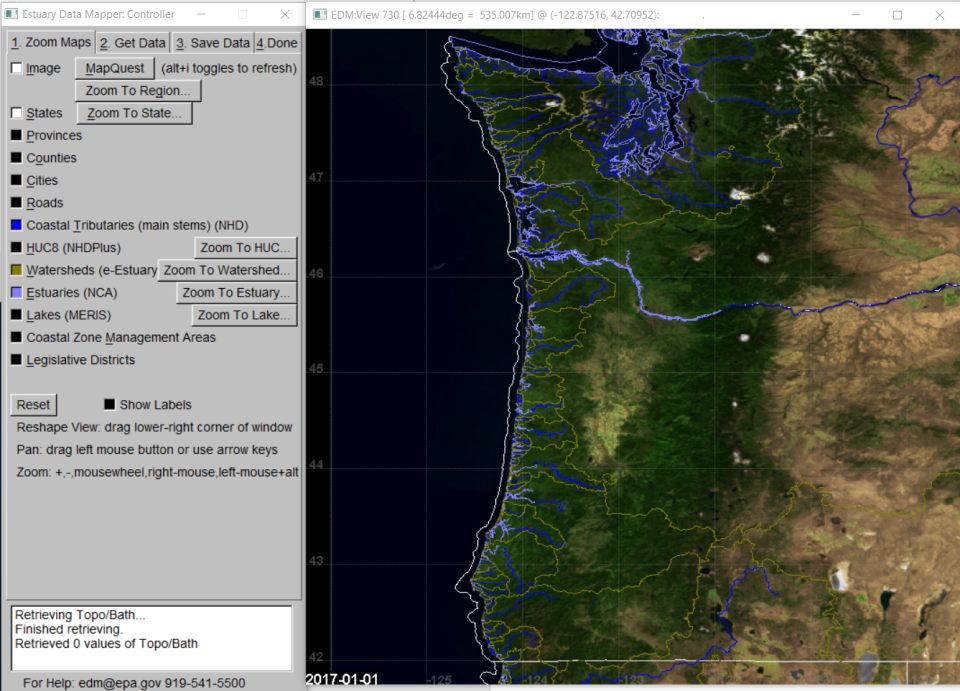
We have recently updated the estuarine characteristics datasets in EDM, starting out by expanding the base set of estuaries included in EDM with the addition of many of the smaller estuaries on the West Coast represented in the Pacific Marine and Estuarine Fish Habitat Partnership dataset. Boundaries for all, including updated estuary polygons are accessible by turning on estuaries in the first tab, as shown in Figure 2.
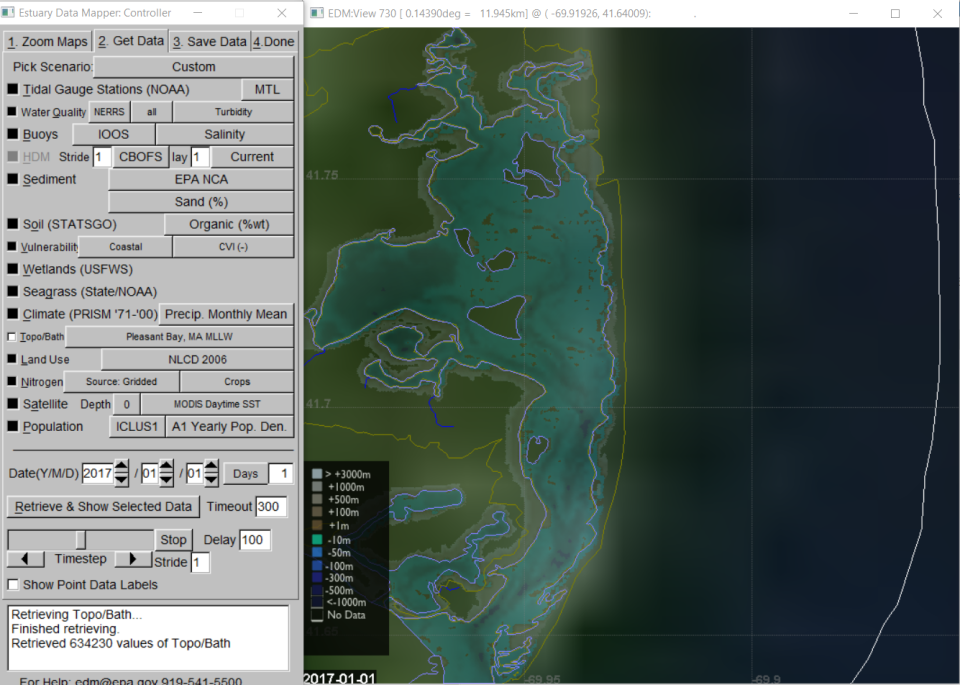
New datasets included in the estuarine characteristics dataset include updated topobathymetry, derived from the finest resolution dataset available for each individual estuary, found in its original location on the Get Data tab – Custom Scenario – Topo/Bath (Figure 3). Topobathymetry boundaries extend beyond the estuary polygons as they represent the extent of contiguous water when at the historic high tide mark. You must have previously zoomed into an estuary of interest to see the retrieved topobathymetry.
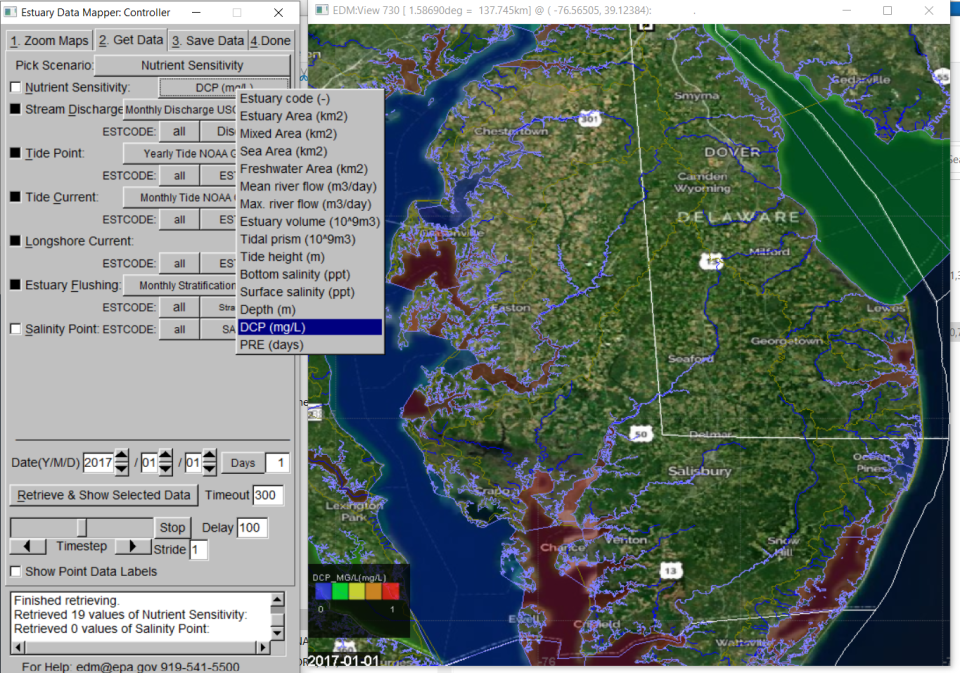
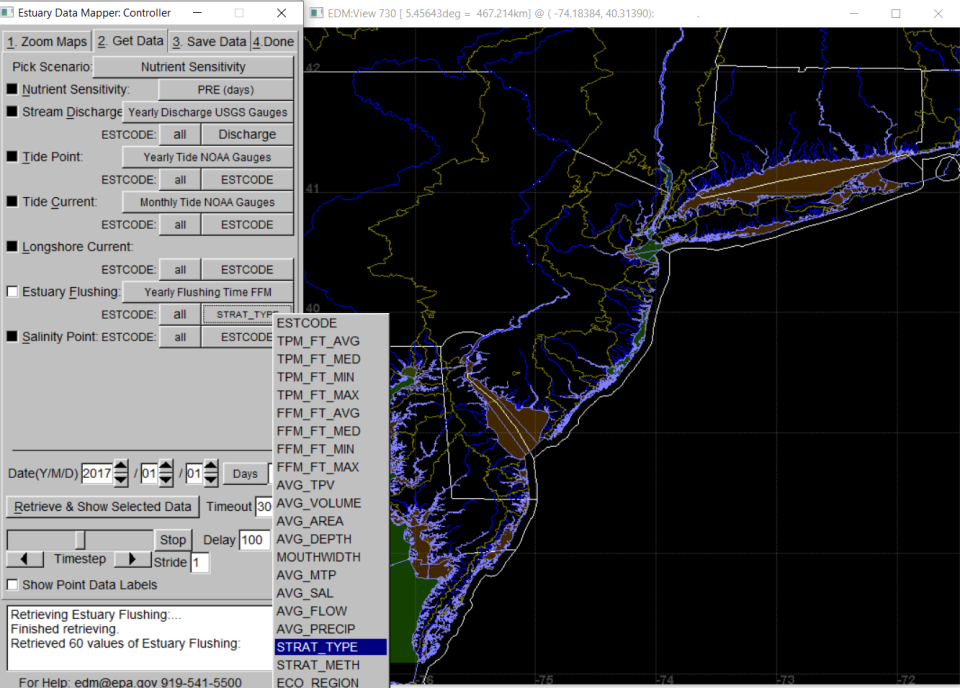
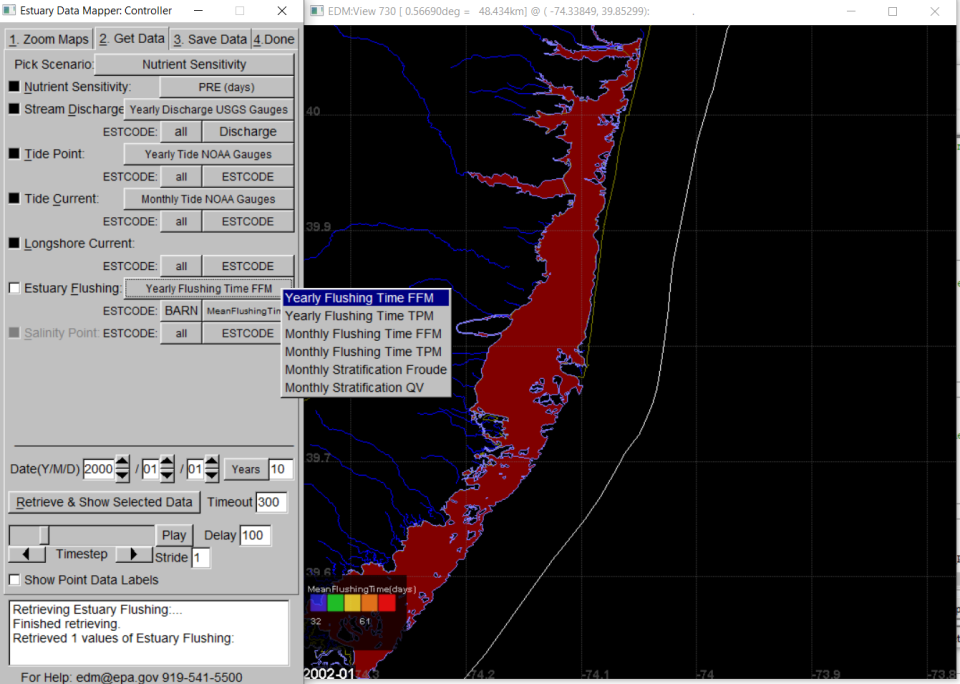
Estuarine sensitivity to nutrients has been characterized by stratification class using either QV or Froude number methods (well-mixed, partially mixed, strongly stratified) (Figure 4) and flushing time in days, calculated by one of two methods (freshwater fraction method (FFM) or tidal prism volume method (TPM)) (Figure 5). These and other summary estuarine characteristics can be retrieved from the Estuary Flushing button under the Nutrient Sensitivity Scenario on the Get Data tab.
If ESTCODE of “ALL” is selected, users will have access to summary statistics for a variety of related characteristics across all estuaries displayed. For the Nutrient Sensitivity Scenario selections, users can select to display and retrieve data for all estuaries within the viewing window (ALL), or only for a selected estuary (or subestuary) of interest, the latter by selecting the ESTCODE of interest. Zooming in to an estuary of interest is accomplished on the first tab as before, i.e., selection of individual estuaries on the NSS page will not zoom into that estuary but only restrict data retrievals.
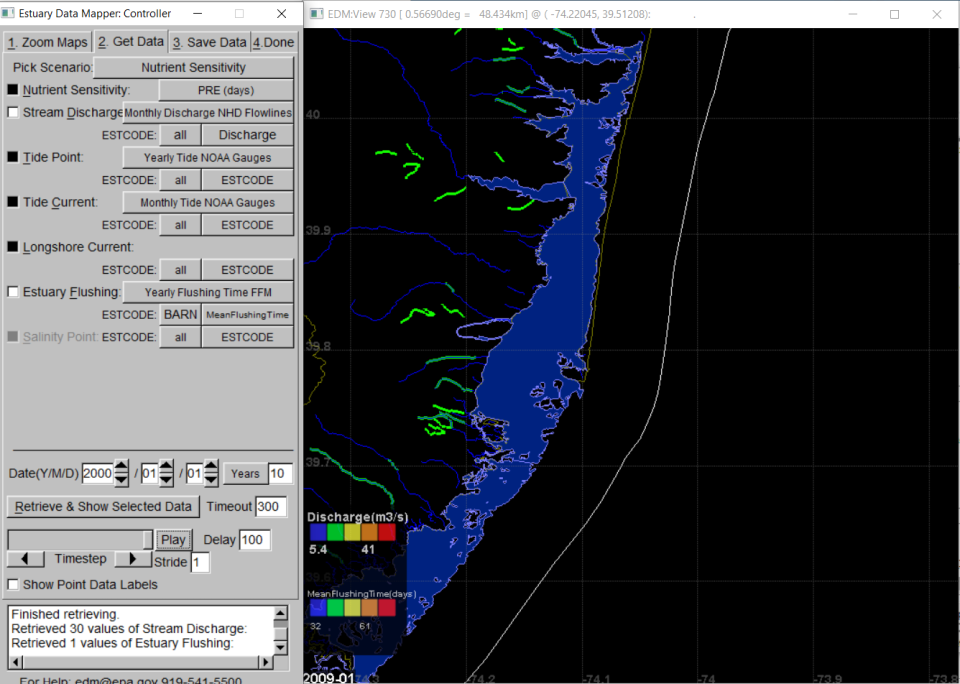
A variety of associated datasets were compiled for calculation of estuarine stratification indices and flushing time, including freshwater discharge, tidal amplitude, tidal current, and longshore currents and these are also available within the Nutrient Sensitivity Scenario. For each of these data sets, the user selects a data source, then selects a parameter of interest from the submenu (drop-down list) on the next line next to the estuary identifier (Figure 6). Static (non-time-varying variables) are listed in CAPS in the variable lists, while those for which time series are available are listed in Title Case. More information on each variable, including the relevant time frame, can be found by hovering the cursor over the selected variable button.
The freshwater discharge button provides access to time series of annual or monthly discharge measured at individual USGS gauging stations as well as discharge estimates for terminal (nontidal) reaches upstream of estuaries.
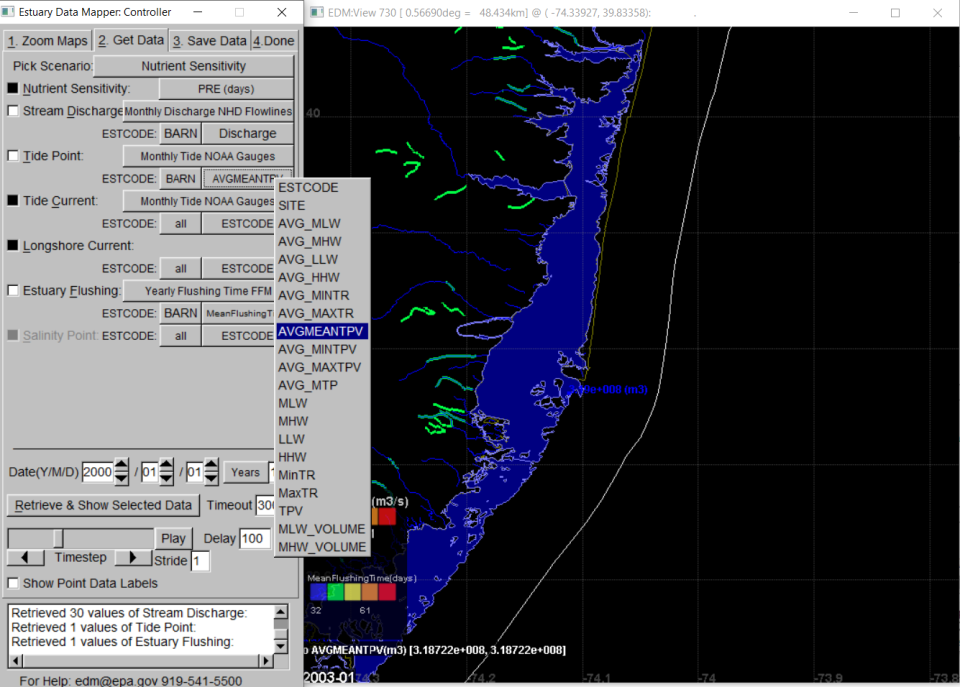
From the Tide Point button (Figure 7) , users can retrieve information on tidal datum, tidal range, volumes, and tidal prism volumes.
Tidal currents are used in the calculation of Froude numbers to evaluate likelihood of estuarine stratification; these can be retrieved from the Tide_Current button. Longshore current velocities (accessible via the Longshore Current button) are used in the estimation of return factors (the proportion of tidal volume from one tidal cycle not removed from the estuary mouth and returning to the estuary in the next tidal cycle. Incomplete flushing tends to increase estuarine flushing time. The Salinity button provides access to the boundary conditions for each estuary (ocean salinity at mouth) or estuary segment as well as data from individual salinity monitoring stations within each estuary used in estimation of stratification parameters and flushing time by Freshwater Fraction method.
More details on original data sources and calculations can be found in the metadata downloaded with each dataset and in the following article: Shen, X., Detenbeck, N., & You, M. (2022). Spatial and temporal variations of estuarine stratification and flushing time across the continental US. Estuarine, Coastal and Shelf Science, 279, 108147.
December 7, 2020
- Nutrient Sensitivity Scenario that includes both the original Nutrient Sensitivity data (moved from the Vulnerability data button's Source Menu) plus the new Stream Discharge data (Yearly and Monthly USGS gauges and NHD flowlines). Additional variables related to estuarine nutrient sensitivity will be added over the next few months.
- VT/NH High resolution impervious data to the Green Development Scenario.