
Web Access to RSIG Data
Researchers with sufficient programming experience can use a web service to obtain data from RSIG and Estuary Data Mapper (EDM) without having to use the RSIG or EDM applications.
End users who are interested in bulk data transfer may opt to use the web service directly, or incorporate it into an automated script.
You may also want to read more about web service queries and essential performance tips.
- About the web service
- Anatomy of a web service call
- Popular RSIG data sources
- Output data formats
- Command-line examples using cURL
- Code used to perform CMAQ column integration
About the RSIG API web service
The RSIG web service (rsigserver) is OGC-WCS/WMS-compliant.
The following links exit the site
- Open Geospatial Consortium's Web Coverage Service (WCS) standards
- Open Geospatial Consortium's Web Map Service (WMS)
Essential information about the web service is as follows:
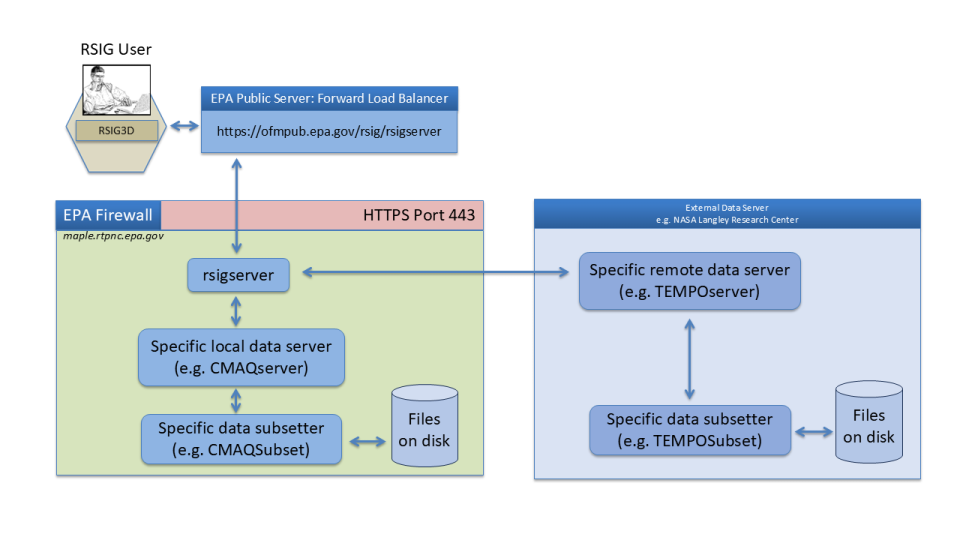
- The purpose of rsigserver is to stream (over a network) aggregated (across multiple source data files) subsets (by time-range, variables, longitude-latitude-layer domain) of data into client applications (without the need for first writing files to disk, as in ftp).
- EMVL extends rsigserver each time a new data source is requested for RSIG.
- All data are GMT-hourly.
- Longitude, latitude, elevation (meters above MSL when available), and GMT timestamps are always included implicitly to facilitate geospatial-temporal data alignment.
Anatomy of a web service call
To create a webservice call you must first construct a URL of the proper form, which is outlined below. To get started you may want to obtain data with the RSIG3D desktop application, which prints the URL for every data request it makes. You can copy/paste the URL to use as a basis for constructing other customized URLs. Examples of full URLs are given in the Command Line Example section below.
The URL for typical RSIG API calls is composed of three main parts: a basename, mandatory key/value pairs, and optional key/value pairs. Some of the optional key/value pairs are specific to certain data types. The key/value pairs are always separated by ampersands (&) in the URL string. Some people may find the length of the URL string to be long and daunting, but if you break it down into its constituent components it is easy to understand.
Basename: The basename below specifies the RSIG server and web service. The question mark signifies the end of the basename and the beginning of a series of key/value pairs to follow that specify details about the data that is being requested.
https://ofmpub.epa.gov/rsig/rsigserver?
Mandatory key/value pairs: The mandatory key/value pairs are required in part to make the RSIG API OGC-WCS compliant. They also describe basic details about the data request including the data source, the desired format, and the spatial and temporal extents of the data being requested as shown in the table below.
| Mandatory key | Value | Notes |
|---|---|---|
| SERVICE | WCS | This value should not be changed and indicates that data is being requested. |
| VERSION | 1.0.0 | This value should not be changed and indicates the OGC specification level. |
| REQUEST |
|
|
| COVERAGE | The data being requested | The RSIG API provides access to over 5,000 specific data sources and variables. You can discover them by using GetCapabilities (see examples below), or by inspecting the data selection options in the RSIG3D desktop application. As an example, the COVERAGE for AirNow PM2.5 is airnow.pm25 . |
| FORMAT |
| Choose which format you want for the returned data:
You can find out more about these formats and their compatibility with other software in the WCS Output Data Formats section below. |
| TIME | ISO-8601 time range | Example: 2025-07-15T14:00:00Z/2025-07-15T14:59:59Z |
| BBOX | Rectangular lon/lat bounding box of the form west,south,east,north (no spaces). For data with a vertical component there are two additional parameters specifying the upper and lower extents of the desired data. For CMAQ, the upper and lower extents are layer numbers. For other 3D variables, the upper and lower extents are elevations in meters above mean sea level. Popular 3D datasets include CMAQ and CALIPSO. Accidentally including the additional parameters for a 2D dataset will have no effect. |
|
Optional key/value pairs: Other key/value pairs can be specified to tailor your request.
| Optional key | Value | Notes |
|---|---|---|
| COMPRESS | 0 or 1 | 0=no compression, 1=data stream is compressed with gzip. Default is 0. |
| CORNERS | 0 or 1 | If CORNERS=1 is specified, polygon-based data (such as satellite or CMAQ model data) will include the lon/lat coordinates of each data cell's vertices. This option has no effect on point-based data. Default is 0. |
Data specific key/value pairs: Some data sources have key/value pairs that affect data filtering. If omitted, the filter values will default to the values recommended by the respective science teams for general use.
| CALIPSO optional key | Value | Notes |
|---|---|---|
| MAXIMUM_UNCERTAINTY | Floating point value between 0 and 99 | Maximum accepted uncertainty of measurement in absolute units (not percentage). Default is 99. |
| MINIMUM_CAD | Integer value between 20 and 100 | 20 means least likely, but better than 50/50 chance of correctly distinguished aerosol/cloud features. 100 means highest likelihood of correctly distinguished aerosol/cloud features. Default is 20. |
| CMAQ optional key | Value | Notes |
|---|---|---|
| AGGREGATE |
| Time aggregation. Default is NONE. |
| CORNERS | 0 or 1 | If CORNERS=1 is specified, CMAQ data will include the lon/lat coordinates of each data cell's vertices. Default is 0. |
| INTEGRATE | 0 or 1 | 0= do not integrate layers, 1 = integrate layers. Default is 0. For detailed information about how the integration is performed, see the sample code below. |
| KEY | alphanumeric | Access key for the cmaq.oaqps data source. |
| NOELEVATION | 0 or 1 | 1 = omit ELEVATION variable in the output. Default is 0. |
| NOLONLATS | 0 or 1 | 1 = omit lon/lat variables in XDR output to reduce the size of the data stream. Default is 0. |
| GASP optional key | Value | Notes |
|---|---|---|
| AOD_RANGE | min,max | AOD is the aerosol optical depth. Any data outside the specified range is filtered out. Default is full range. |
| CH1_RANGE | min,max | CH1 is the channel 1 visible reflectance data. Any outside the specified range is filtered out. Default is full range. |
| CLS_RANGE | min,max | CLS is the sum of the binary cloud screen for a 5x5 array surrounding each pixel. Any data outside the specified range is filtered out. Default is full range. |
| CORNERS | 0 or 1 | If CORNERS=1 is specified, GASP data will include the lon/lat coordinates of each data cell's vertices. Default is 0. |
| MOS_RANGE | min,max | MOS is the composite background image (visible) reflectance. Any data outside the specified range is filtered out. Default is full range. |
| SCA_RANGE | min,max | SCA is AOD data scaled to a range of 0-255. Any data outside the specified range is filtered out. Default is full range. |
| SFC_RANGE | min,max | SFC is the surface reflectance. Any data outside the specified range is filtered out. Default is full range. |
| SIG_RANGE | min,max | SIG is the aerosol signal. Any data outside the specified range is filtered out. Default is full range. |
| STD_RANGE | min,max | STD is the aerosol optical depth standard deviation. Any data outside the specified range is filtered out. Default is full range. |
| HRRR optional key | Value | Notes |
|---|---|---|
| CMAQ | 0 or 1 | 0 = Grid XDR format, 1 = SUBSET CMAQ format. Default is 0. |
| STRIDE | Integer value between 1 and 100 | Number of rows and columns in the gridded dataset to skip, so that the amount of returned data will be less. This options is useful when you want to reduce the size of the returned dataset, particularly for visualization purposes. Default is 1 (no skipping). |
| OMI optional key | Value | Notes |
|---|---|---|
| ALLOW_NEGATIVE_COUNTS | 0 or 1 | 0=do not allow negative counts, 1= allow negative counts. Default is 0. Certain data sources, including OMI may have values that are slightly negative due to data processing artifacts. Normally these values are filtered out, but specifying ALLOW_NEGATIVE_COUNTS=1 will ensure that the negative values remain. |
| CORNERS | 0 or 1 | If CORNERS=1 is specified, OMI data will include the lon/lat coordinates of each data cell's vertices. Default is 0. |
| MAXIMUM_CLOUD_FRACTION | Floating point value between 0 and 1 | This is used to filter out data that likely contains clouds. Default is 1 (clouds not filtered). |
| MAXIMUM_SOLAR_ZENITH_ANGLE | Floating point values between 0 and 90 | Solar zenith angle above of the specified value will be filtered out. Default is 90. |
| Pandora optional key | Value | Notes |
|---|---|---|
| AGGREGATE |
| This specifies the level of time aggregation. Default is none. |
| INSTRUMENT | alphanumeric | Only obtain data for a specific Pandora sensor ID. Default is all sensors. |
| MINIMUM_QUALITY | low, medium, or high | Using the low quality flag will return the most data, while the medium and high quality flags will return less data but with higher reliability. Default is high. |
| TEMPO optional key | Value | Notes |
|---|---|---|
| ALLOW_NEGATIVE_COUNTS | 0 or 1 | 0=do not allow negative counts, 1= allow negative counts. Default is 0. TEMPO data may have values that are slightly negative due to data processing artifacts. Normally these values are filtered out, but specifying ALLOW_NEGATIVE_COUNTS=1 will ensure that the negative values remain. |
| CORNERS | 0 or 1 | If CORNERS=1, the verticies of each cell polygon will be returned along with the usual data. Default is 0. |
| MAXIMUM_CLOUD_FRACTION | Floating point value between 0 and 1 | This is used to filter out data that likely contains clouds. Defaults to 1. |
| MAXIMUM_SOLAR_ZENITH_ANGLE | Floating point value between 0 and 90 | Solar zenith angle above of the specified value will be filtered out. Defaults to 90. |
| MINIMUM_QUALITY_FLAG |
| Normal returns the highest quality data, while suspect and bad return progressively lower quality data. If no data is returned it is possible that all data is being filtered out. Defaults to normal. |
| TROPOMI optional key | Value | Notes |
|---|---|---|
| ALLOW_NEGATIVE_VALUES | 0 or 1 | 0=do not allow negative counts, 1= allow negative counts. Default is 0. TROPOMI data may have values that are slightly negative due to data processing artifacts. Normally these values are filtered out, but specifying ALLOW_NEGATIVE_COUNTS=1 will ensure that the negative values remain. |
| CORNERS | 0 or 1 | If CORNERS=1, the vertices of each cell polygon will be returned along with the usual data. Default is 0. |
| GROUND_PIXEL_RANGE | min,max Integer values between 0 and 449 | The ground pixel range is used to limit the extents of the satellite swath. The nominal range of OFFL NO2 and HCHO is 0-449. The nominal range of OFFL CH4 and CO is 0-214. Defaults to full range. |
| MAXIMUM_CLOUD_FRACTION | Floating point value between 0 and 1 | This is used to filter out data that likely contains clouds. Defaults to 1. |
| MINIMUM_QUALITY | Floating point value between 0 and 100 | Only data points with a quality flag above the specified level will be returned. Defaults to 100. |
| VIIRS optional key | Value | Notes |
|---|---|---|
| CORNERS | 0 or 1 | If CORNERS=1, the vertices of each cell polygon will be returned along with the usual data. Default is 0. |
| MINIMUM_QUALITY_FLAG | medium or high | Only data points with the specified quality flag will be returned. Defaults to high. |
Putting it all together: To construct a URL, start with the basename and then append key value pairs separated by ampersands. Make sure that there are no spaces or line breaks anywhere in the URL. The order of the key/value pairs does not matter, but standard practice is to list the mandatory ones first, followed by the optional ones. Here is an example that will request AirNow PM2.5 data for August 1, 2025 in ASCII (plain text) format. More examples can be found in the Command Line Examples below.
Popular RSIG data sources
The table below lists some of the popular data sources available via RSIG, but is by no means exhaustive. RSIG can serve over 5,000 data sources and variables. See the full list of RSIG variables for more information. Note that a given source (e.g. airnow) may have many variables that can be requested (e.g. pm25, ozone, no2).
| Source | Description | Variables |
|---|---|---|
| AirNow (EPA) | AirNow ground stations. | airnow.pm25, airnow.ozone, airnow.no2 |
| AQS (EPA) | AQS Data Mart ground stations. | aqs.pm25, aqs.pm25_daily_average, aqs.ozone, aqs.ozone_8hour_average, aqs.ozone_daily_8hour_maximum |
| CMAQ EQUATES (EPA) | CMAQ modeled gridded met and air-quality data. | cmaq.equates.conus.conc.no2 |
| HMS (NOAA) | Satellite based fire and smoke detections. | hms.fire_power, hms.smoke |
| HRRR (NOAA) | High Resolution Rapid Refresh meteorological model | hrrr.wind_10m |
| METAR (NWS) | Meteorological measurements associated with airports worldwide. | metar.wind, metar.temperature |
| MODIS (NASA) | Moderate resolution imaging spectroradiometer in low-Earth orbit delivering daily overpasses. | modis.mod4.Optical_Depth_Land_And_Ocean |
| OMI (NASA) | Satellite based imaging spectrometer in low-Earth orbit delivering daily overpasses. | omi.l2.omto3.ColumnAmountO3, omi.l2.omno2.ColumnAmountNO2Trop |
| PurpleAir (PurpleAir, Inc.) | Network of low-cost PM2.5 sensors from PurpleAir Inc. The "pm25_corrected" variable has an EPA derived correction factor applied to improve the accuracy of the PM2.5 measurements in most cases. EPA only access. | purpleair.pm25_corrected |
| TEMPO (NASA) | Satellite based imaging spectrometer in geosyncronous orbit delivering hourly measurements during daylight hours. | tempo.l2.no2.vertical_column_troposphere |
| TROPOMI (ESA) | Satellite based imaging spectrometer in low-Earth orbit delivering daily overpasses. | tropomi.offl.no2.nitrogendioxide_total_column |
WCS Output data formats
| Format | Description |
|---|---|
| ASCII | Tab-delimited spreadsheet. Use with compression (&COMPRESS=1) to improve download speed. Good for spreadsheets and scripts. |
| XDR | Text header with followed by data encoded using the XDR standard. Good for streaming to custom software. |
| NetCDF-COARDS | NetCDF file with COARDS metadata conventions. See NetCDF documentation for a list of compatible software. |
| NetCDF-IOAPI | NetCDF file with IOAPI conventions. Compatible with IDV, Panoply, and CMAQ-related-utilities. |
| Original | Original (unsubsetted) satellite files (tarred and gzipped). WARNING: large files and slow downloads! |
Command-line examples using cURL
To help craft WCS queries, you can use cURL, a command available on multiple platforms for transferring data. As summarized on the cURL home page :
curl is an open source command line tool and library for transferring data with URL syntax that compiles and runs under a wide variety of operating systems....
The easiest way to learn these WCS commands is to run RSIG3D and inspect the status window in the lower left hand corner after a data request is made. The exact WCS call used by the application is echoed to the status window, and can be used as a starting point for constructing custom WCS calls.
Note that in the examples below, the curl commands should all be entered on a single line.
Note for Windows users: The command-line examples below should be run in a Powershell terminal. You may need to replace 'curl' in the examples below with 'curl.exe'.
List available datasets from the RSIG WCS server
curl --silent --retry 0 -L --tcp-nodelay --max-time 0 'https://ofmpub.epa.gov/rsig/rsigserver?SERVICE=wcs&VERSION=1.0.0&REQUEST=GetCapabilities'
Listing just the names of available variables from a script
curl --silent --retry 0 -L --tcp-nodelay --max-time 0 'https://ofmpub.epa.gov/rsig/rsigserver?SERVICE=wcs&VERSION=1.0.0&REQUEST=GetCapabilities' |grep name | grep -v WCS | sed 's/<name>//g; s/<\/name>//g' | tr -d '[:blank:]'
Using DescribeCoverage to get more information about AirNow PM2.5
curl --silent --retry 0 -L --tcp-nodelay --max-time 0 'https://ofmpub.epa.gov/rsig/rsigserver?SERVICE=wcs&VERSION=1.0.0&REQUEST=DescribeCoverage&COVERAGE=airnow.pm25'
Getting metadata about TROPOMI NO2
curl --silent --retry 0 -L --tcp-nodelay --max-time 0 'https://ofmpub.epa.gov/rsig/rsigserver?SERVICE=wcs&VERSION=1.0.0&REQUEST=GetMetadata&COVERAGE=tropomi.offl.no2.nitrogendioxide_total_column&TIME=2026-02-01T17:00:00Z/2026-02-01T17:59:59Z&BBOX=-78,37,-76,38&FORMAT=ascii'
Getting ASCII format data from TROPOMI NO2
curl --silent --retry 0 -L --tcp-nodelay --max-time 0 'https://ofmpub.epa.gov/rsig/rsigserver?SERVICE=wcs&VERSION=1.0.0&REQUEST=GetCoverage&COVERAGE=tropomi.offl.no2.nitrogendioxide_total_column&TIME=2026-02-01T17:00:00Z/2026-02-01T17:59:59Z&BBOX=-78,37,-76,38&FORMAT=ascii'
Getting XDR-format MODIS AOD data from NASA Goddard
curl --silent --retry 0 -L --tcp-nodelay --max-time 0 'https://ofmpub.epa.gov/rsig/rsigserver?SERVICE=wcs&VERSION=1.0.0&REQUEST=GetCoverage&FORMAT=xdr&TIME=2025-07-15T14:00:00Z/2025-07-15T14:59:59Z&BBOX=-126.0,24.0,-66.0,50.0&COVERAGE=modis.mod4.Optical_Depth_Land_And_Ocean' > modis_sample1.xdr
Compression/decompression is optional but recommended when streaming large amounts of data over long-distance networks. To use compression, add the &COMPRESS=1 option to return data that has been gzipped. Windows users may need to get a decompression utility such as 7zip to uncompress .gz files.
Same as above but including MODIS cell corner points
curl --silent --retry 0 -L --tcp-nodelay --max-time 0 'https://ofmpub.epa.gov/rsig/rsigserver?SERVICE=wcs&VERSION=1.0.0&REQUEST=GetCoverage&FORMAT=xdr&TIME=2025-07-15T14:00:00Z/2025-07-15T14:59:59Z&BBOX=-126.0,24.0,-66.0,50.0&COVERAGE=modis.mod4.Optical_Depth_Land_And_Ocean&CORNERS=1' > modis_sample2.xdr
The CORNERS=1 option will result in 8 additional variables: Longitude_SW, Longitude_SE, Longitude_NW, Longitude_NE, Latitude_SW, Latitude_SE, Latitude_NW, Latitude_NE which are the linearly interpolated/extrapolated corner points surrounding each MODIS ground point center to provide quadrillateral cells for each MODIS data point.
Getting CALIPSO satellite LIDAR data in ascii format
curl --silent --retry 0 -L --tcp-nodelay --max-time 0 'https://ofmpub.epa.gov/rsig/rsigserver?SERVICE=wcs&VERSION=1.0.0&REQUEST=GetCoverage&FORMAT=ascii&TIME=2023-06-15T00:00:00Z/2023-06-15T23:59:59Z&BBOX=-95.0,34.0,-89.0,38.0,0,40000&COVERAGE=calipso.l1.Total_Attenuated_Backscatter_532&MINIMUM_CAD=20&MAXIMUM_UNCERTAINTY=99'
Getting CMAQ wind data for the lowest grid layer (in IOAPI format)
curl --silent --retry 0 -L --tcp-nodelay --max-time 0 'https://ofmpub.epa.gov/rsig/rsigserver?SERVICE=wcs&VERSION=1.0.0&REQUEST=GetCoverage&COVERAGE=cmaq.equates.conus.metdot3d.wind&TIME=2005-08-28T20:00:00Z/2005-08-29T01:59:59Z&BBOX=-90,30,-88,32,1,1&FORMAT=netcdf-ioapi' > cmaq_sample.nc
To obtain data for all layers, omit the last two values of BBOX:
BBOX=-90,30,-88,32
To obtain the first three layers:
BBOX=-90,30,-88,32,1,3
Optional compression/decompression
...&COMPRESS=1' | gzip -d > sample.nc
Regridding one day of TEMPO NO2 data to layer one of the CMAQ EQUATES 12km grid in Lambert space (saved as NetCDF IOAPI format)
curl --silent --retry 0 -L --tcp-nodelay --max-time 0 'https://ofmpub.epa.gov/rsig/rsigserver?SERVICE=wcs&VERSION=1.0.0&REQUEST=GetCoverage&FORMAT=netcdf-ioapi&TIME=2026-03-01T17:00:00Z/2026-03-01T18:59:59Z&BBOX=-125,25,-65,50&COVERAGE=tempo.l2.no2.vertical_column_troposphere&CORNERS=1&MINIMUM_QUALITY=normal&MAXIMUM_CLOUD_FRACTION=0.15&MAXIMUM_SOLAR_ZENITH_ANGLE=70.0®RID=weighted&LAMBERT=33.0,45.0,-97.0,40.0&ELLIPSOID=6370000,6370000&GRID=459,299,-2556000,-1728000,12000,12000' > cmaq_sample_regridded.nc
Example Windows and UNIX scripts for automated downloads
Contact the RSIG team for a sample script that will automate downloads using cURL.
Code used to perform CMAQ column integration
The C code below is used to numerically integrate data layers (ppmV) and convert to molecules/cm2.
/******************************************************************************PURPOSE: integrateLayers - Integrate data (ppmV) over layers to molecules/cm2.INPUTS: const size_t timesteps Number of timesteps.const size_t layers Number of layers.const size_t rows Number of rows.const size_t columns Number of columns.const float* const zf Layer thicknesses in meters:zf[ timesteps ][ layers ][ rows ][ columns ]const float* const dens Density of dry air in kg/m3:dens[ timesteps ][ layers ][ rows ][columns]float* const data Concentration data (ppmV) to integrate:data[ timesteps ][ layers ][ rows ][columns]OUTPUTS: float* const data Layer-integrated data in molecules/cm2:data[ timesteps ][ 1 ][ rows ][ columns ]NOTES: Column integrated concentration won't handle BADVAL3 values.The CMAS M3 package ignores the impact of water vapor variations on the molarmass (and density) of air, so I will do the same.This makes the calculation very easy.Final units should be molecules per cm^2.Trace gas column =Vertical integral of Full Layer height * air mass density / molar mass of air* gas mixing ratio * Avogadro’s numberCONC and METCRO Variables:Layer Height = ZF(i) – ZF (i-1) where ZF(0) =0;Air mass density = DENS;Gas mixing ratio = CONC;Constants:REAL, PARAMETER :: AVO = 6.0221367e23 ! Avogadro's Constant [ number/mol ]REAL, PARAMETER :: MWAIR = 28.9628 ! mean molecular weight for dry air [g/mol]! FSB: 78.06% N2, 21% O2, and 0.943% A on a mole! fraction basis ( Source : Hobbs, 1995) pp. 69-70REAL, PARAMETER :: DENS_CONV = ( 1.0E3 * AVO / MWAIR ) * 1.0E-6! convert from kg/m**3 to #/ccREAL, PARAMETER :: PPM_MCM3 = 1.0E-06! convert from ppm to molecules / cc mol_Spec/mol_Air = ppm * 1E-06REAL, PARAMETER :: M2CM = 1.0E2 ! meters to centimetersREAL, PARAMETER :: M2CM1 = 1.0E-6 ! 1/ m**3 to 1/ cm**3******************************************************************************/static void integrateLayers( const size_t timesteps,const size_t layers,const size_t rows,const size_t columns,const float* const zf,const float* const dens,float* const data ) {PRE07( timesteps > 0, layers > 0, rows > 0, columns > 0, zf, dens, data );const double cm_per_m = 100.0; /* Centimenters per meter. *//* Cubic meters per cubic centimeter: */const double m3_per_cm3 = 1.0 / ( cm_per_m * cm_per_m * cm_per_m );const double g_per_kg = 1000.0; /* 1000 g air / kg air. */const double Avogadro_molecules_per_mol = 6.022140857e23; /* number/mol. *//* grams of air / mole of air: */const double mean_molecular_weight_of_dry_air_g_per_mol = 28.9628;const double kg_per_m3_to_moles_per_cm3 =m3_per_cm3 * g_per_kg / mean_molecular_weight_of_dry_air_g_per_mol;const double ppm_to_molecules_per_mole = 1e-6 * Avogadro_molecules_per_mol;const size_t layer_cells = rows * columns;const size_t cells = layers * layer_cells;size_t timestep = 0;for ( timestep = 0; timestep < timesteps; ++timestep ) {const size_t timestep_offset = timestep * cells;const size_t output_offset = timestep * layer_cells;const float* timestep_height = zf + timestep_offset;const float* timestep_density = dens + timestep_offset;const float* timestep_concentration = data + timestep_offset;float* timestep_integration = data + output_offset;size_t layer_cell = 0;for ( layer_cell = 0; layer_cell < layer_cells; ++layer_cell,++timestep_height, ++timestep_density, ++timestep_concentration,++timestep_integration ) {size_t layer = 0;double previous_height_m = 0.0;double sum = 0.0;for ( layer = 0; layer < layers; ++layer ) {const size_t layer_offset = layer * layer_cells;const double height_m = timestep_height[ layer_offset ];const double cell_layer_thickness_m = height_m - previous_height_m;const double cell_layer_thickness_cm =cell_layer_thickness_m * cm_per_m;const double density_kg_per_m3 = timestep_density[ layer_offset ];const double density_moles_per_cm3 =density_kg_per_m3 * kg_per_m3_to_moles_per_cm3;const double concentration_ppm = timestep_concentration[ layer_offset];const double concentration_molecules_per_mole =concentration_ppm * ppm_to_molecules_per_mole;const double term_molecules_per_cm2 =cell_layer_thickness_cm *density_moles_per_cm3 *concentration_molecules_per_mole;sum += term_molecules_per_cm2;previous_height_m = height_m;}*timestep_integration = sum; /*Write layer-integrated result to layer 1*/}}}