U.S. flag

An official website of the United States government

Here’s how you know

Dot gov

Official websites use .gov
A .gov website belongs to an official government organization in the United States.

HTTPS

Secure .gov websites use HTTPS
A lock (LockA locked padlock) or https:// means you’ve safely connected to the .gov website. Share sensitive information only on official, secure websites.

    • Environmental Topics
    • Air
    • Bed Bugs
    • Cancer
    • Chemicals, Toxics, and Pesticide
    • Emergency Response
    • Environmental Information by Location
    • Health
    • Land, Waste, and Cleanup
    • Lead
    • Mold
    • Radon
    • Research
    • Science Topics
    • Water Topics
    • A-Z Topic Index
    • Laws & Regulations
    • By Business Sector
    • By Topic
    • Compliance
    • Enforcement
    • Laws and Executive Orders
    • Regulations
    • Report a Violation
    • Environmental Violations
    • Fraud, Waste or Abuse
    • About EPA
    • Our Mission and What We Do
    • Headquarters Offices
    • Regional Offices
    • Labs and Research Centers
    • Planning, Budget, and Results
    • Organization Chart
    • EPA History

Breadcrumb

  1. Home
  2. National Estuary Program (NEP)

Habitat Efforts from to 2000 to 2018

Habitat Efforts from 2000 to 2018 from the National Estuary Program

Total Year 2018 Habitat Efforts
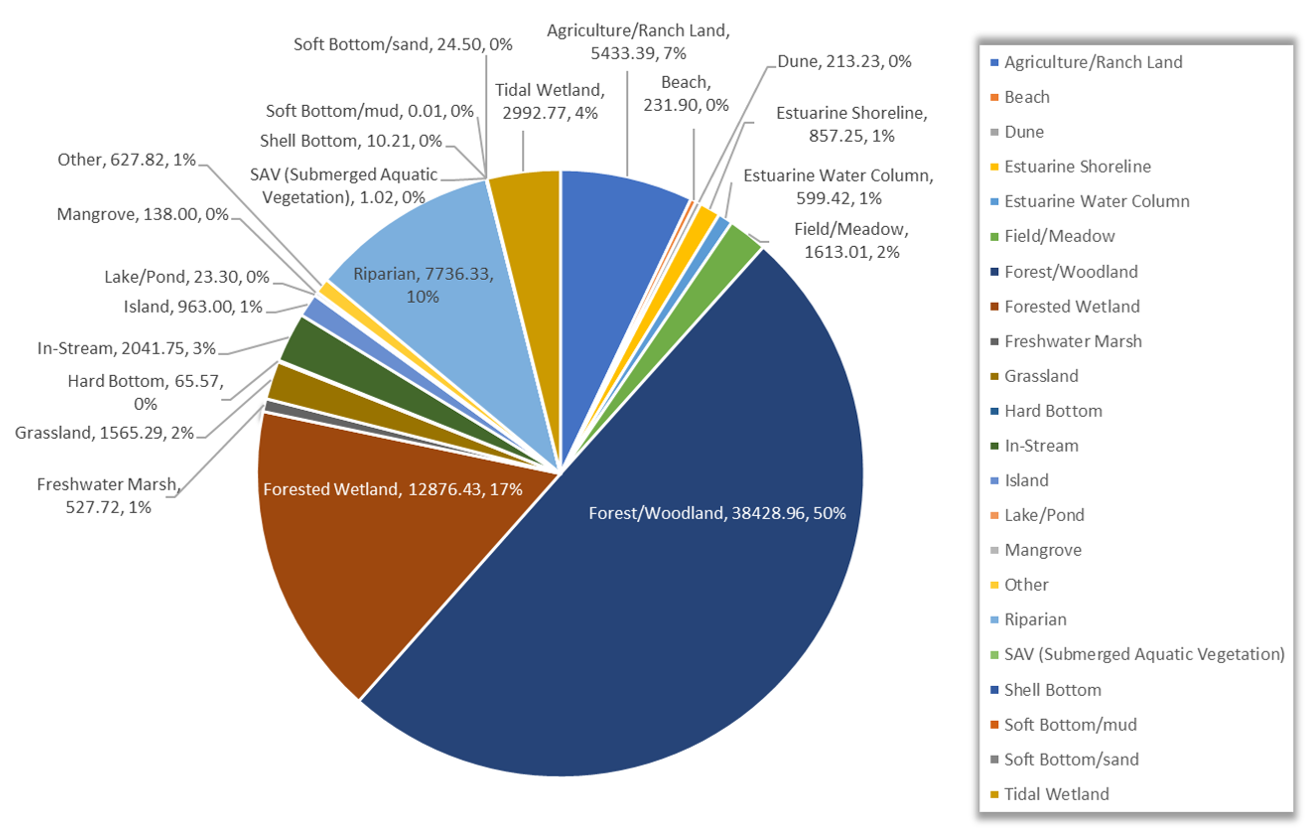
2018 habitat by acres. Beach 231.9; Dune 213.23; Estuarine Shoreline 857.25; Field/Meadow 1613.01; Estuarine Water Column 599.41; Forest/Woodland 38428.96; Forested Wetland 12876.43; Freshwater Marsh 527.72; Grassland 1565.29; Hard Bottom 65.57; In-Stream 2041.75; Island 963.00; Mangrove 138.00; Riparian 7736.33; SAV 1.02; Shell Bottom 10.21; Soft Bottom/Sand 0.01; Soft Bottom/sand 24.50; Tidal Wetland 2992.77; Agriculture/Ranch Land 5433.39
Total Acreage: 76,970.88

Total Year 2017 Habitat Efforts

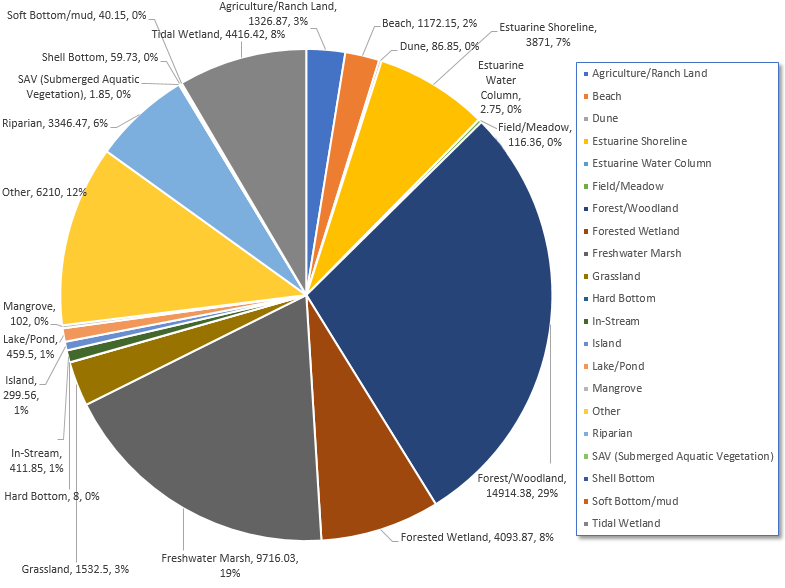
2017 Habitat by Acres
Total Acreage: 52,188.29

Total Year 2016 Habitat Efforts

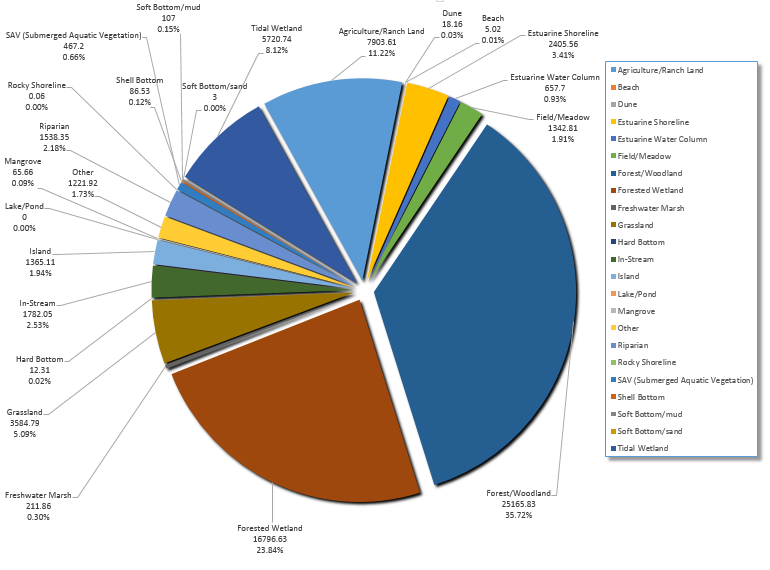
2016 NEP Pie Chart
Total Acreage:  70,462

Total Year 2015 Habitat Efforts

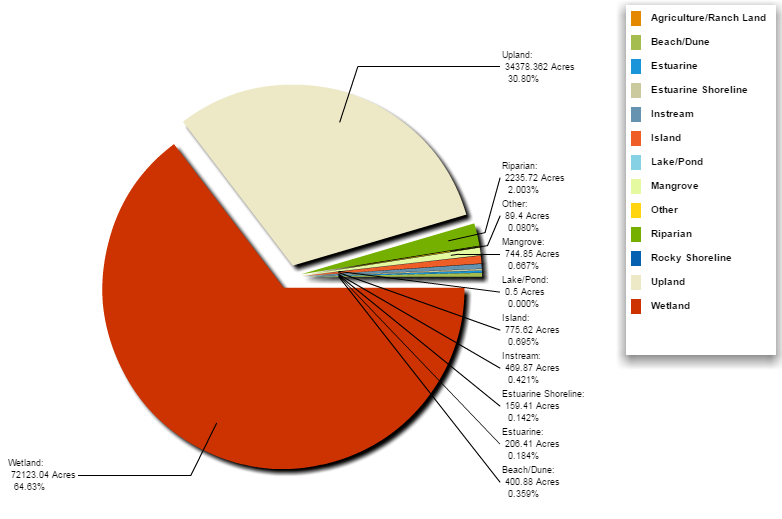
2015 Pie Chart
Total Acreage: 111,584.10

Total Year 2014 Habitat Efforts

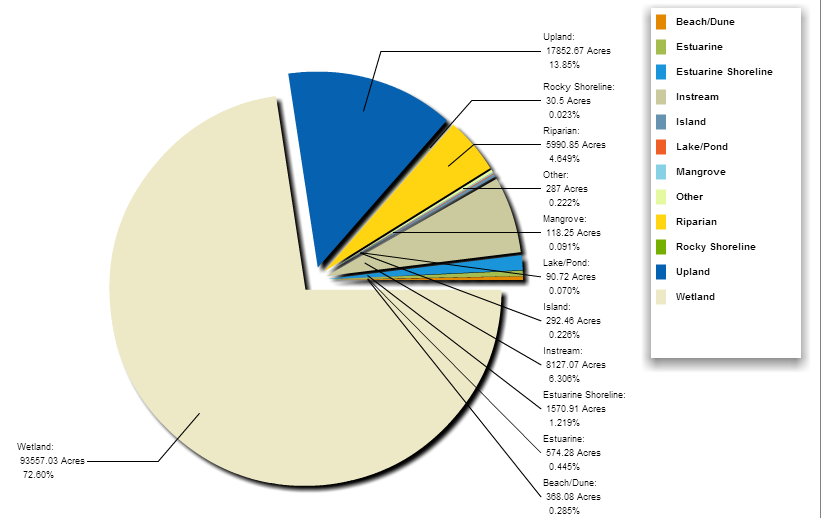
2014 NEP Total Acres restored by Habitat Type
Total Acreage: 128,859.82

Total Year 2013 Habitat Efforts

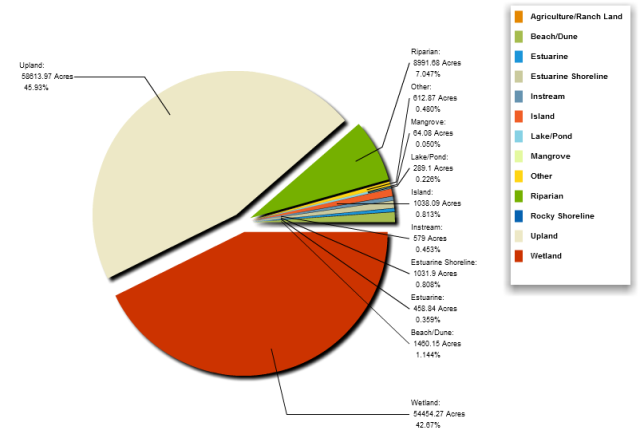
Total acres restored by the NEPs in 2013 equaled 127,593.95 acres
Total Acreage: 127,593.95

Total Year 2012 Habitat Efforts

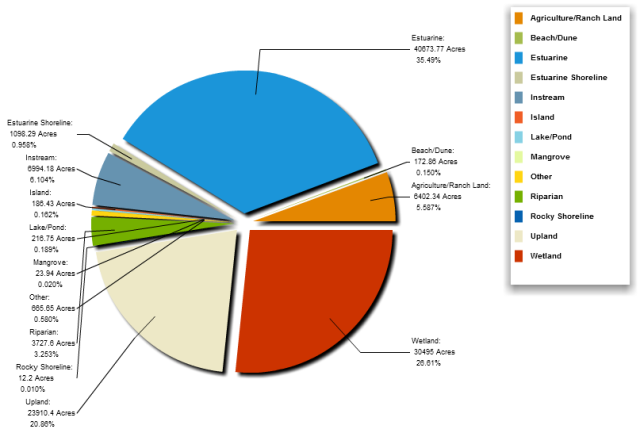
Total acres restored by the NEPs in 2012 equaled 114,579.51 acres
Total Acreage: 114,579.51

Total Year 2011 Habitat Efforts

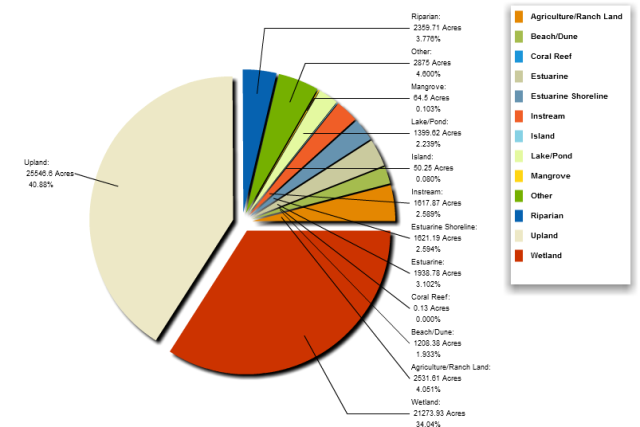
Total acres restored by the NEPs in 2011 equaled 62,487.57 acres
Total Acreage: 62,487.57

Total Year 2010 Habitat Efforts

Total acres restored by the NEPs in 2010 equaled 127,593.95 acres
Total Acreage: 127,593.95

Total Year 2009 Habitat Efforts

Total acres restored by the NEPs in 2009 equaled 125,409.59 acres
Total Acreage: 125,409.59

Total Year 2008 Habitat Efforts

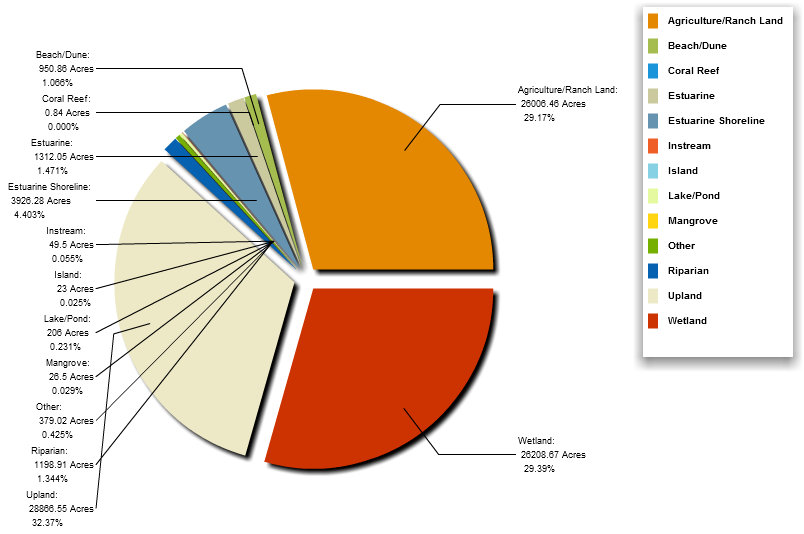
Total acres restored by the NEPs in 2008 equaled 83,490.27 acres
Total Acreage: 83,409.27

Total Year 2007 Habitat Efforts

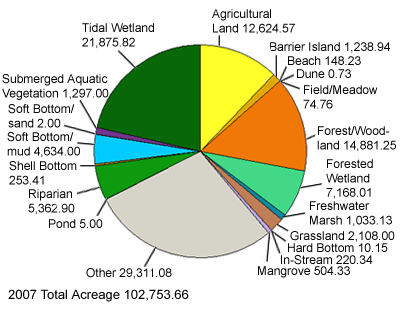
Total acres restored by the NEPs in 2007 equaled 102,753.66 acres
Total Acreage: 102,753.66

Total Year 2006 Habitat Efforts

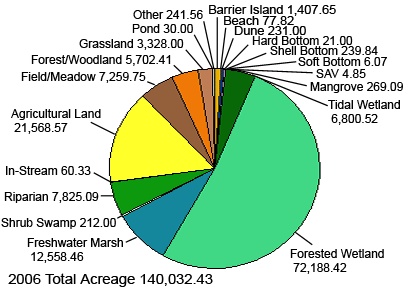
Total acres restored by the NEPs in 2006 equaled 140,032.43 acres
Total Acreage: 140,032.43

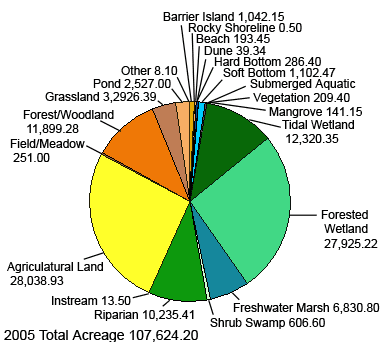
Total Year 2005 Habitat Efforts

Total acres restored by the NEPs in 2005 equaled 107,624.20 acres
Total Acreage: 107,624.20

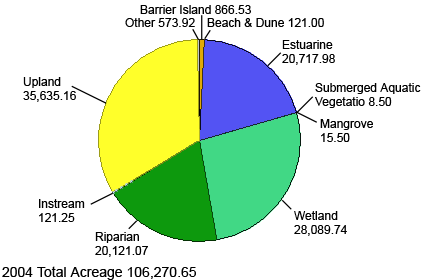
Total Year 2004 Habitat Efforts

Total acres restored by the NEPs in 2004 equaled 106,270.65 acres
Total Acreage: 106,270.65

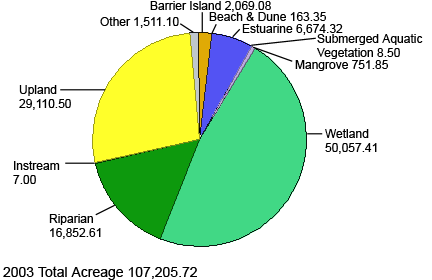
Total Year 2003 Habitat Efforts

Total acres restored by the NEPs in 2003 equaled 107,205.72 acres
Total Acreage: 107,205.72

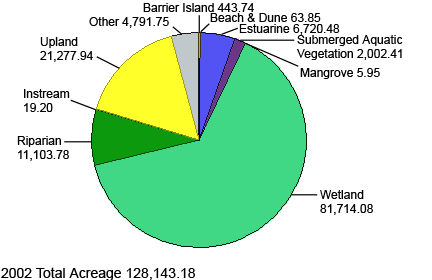
Total Year 2002 Habitat Efforts

Total acres restored by the NEPs in 2002 equaled 128,143.18 acres
Total Acreage: 128,143.18

Total Year 2001 Habitat Efforts

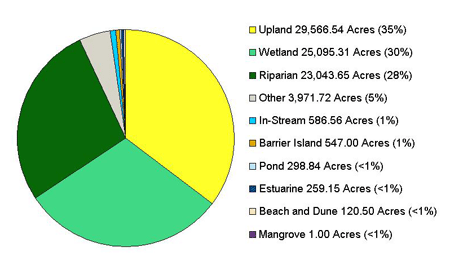
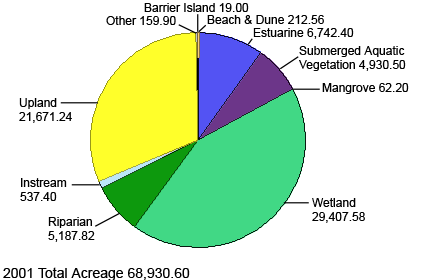
Total acres restored by the NEPs in 2001 equaled 68,930.60 acres
Total Acreage: 68,930.60

Total Year 2000 Habitat Efforts

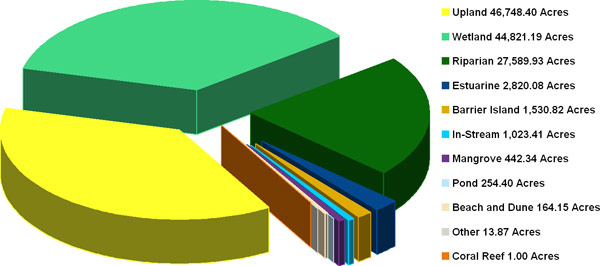
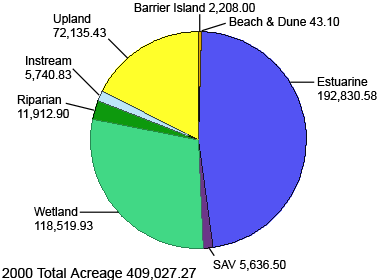
Total acres restored by the NEPs in 2000 equaled 409,027.27 acres
Total Acreage: 409,027.27

National Estuary Program (NEP)

  • National Estuary Program (NEP) Home
    • Basic Information about Estuaries
  • Funding Resources
  • Learn about the National Estuary Program
    • Overview of the NEP
    • National NEP Results
    • Exploring Estuaries
    • NEP Library
      • National Estuary Program Reports
  • Local Estuary Programs
    • Individual Estuary Program Websites
    • Comprehensive Conservation and Management Plans
    • NEPs on Social Media
    • State of the Bay Reports
    • NEP Videos, Virtual Tours and Photo Gallery
  • NEP Success Stories
    • Fact Sheets
    • Habitat Plans
    • How NEPs Address Environmental Issues
      • Aquatic Nuisance Species
      • Climate Change
      • Declines in Fish and Wildlife Populations
      • Habitat Loss and Degradation
      • Nutrient Loads
      • Pathogens
      • Stormwater
      • Toxics
    • Progress Evaluation
    • Successful Watershed Management: NEP Lessons Learned
    • Sustainable Financing Examples
      • Casco Bay Estuary Partnership
      • Coastal Bend Bays & Estuaries Program
      • Partnership for the Delaware Estuary
      • Indian River Lagoon National Estuary Program
      • Narragansett Bay Estuary Program
      • Peconic Estuary Partnership
      • Tampa Bay Estuary Program
Contact Us about National Estuary Program
Contact Us about National Estuary Program to ask a question, provide feedback, or report a problem.
Last updated on July 18, 2024
  • Assistance
  • Spanish
  • Arabic
  • Chinese (simplified)
  • Chinese (traditional)
  • French
  • Haitian Creole
  • Korean
  • Portuguese
  • Russian
  • Tagalog
  • Vietnamese
United States Environmental Protection Agency

Discover.

  • Accessibility Statement
  • Budget & Performance
  • Contracting
  • EPA www Web Snapshot
  • Grants
  • No FEAR Act Data
  • Plain Writing
  • Privacy
  • Privacy and Security Notice

Connect.

  • Data
  • Inspector General
  • Jobs
  • Newsroom
  • Regulations.gov
  • Subscribe
  • USA.gov
  • White House

Ask.

  • Contact EPA
  • EPA Disclaimers
  • Hotlines
  • FOIA Requests
  • Frequent Questions
  • Site Feedback

Follow.