National Results from the National Estuary Program
On this page:
- National Estuary Program (NEP) Habitat Goals
- National Results
- Progress Through Partnerships
- Annual National Estuary Program Habitat Totals
- Habitat Efforts from to 2000 to 2018
National Estuary Program (NEP) Habitat Goals
Like the individual National Estuary Programs, EPA has established goals with respect to habitat in its Strategic Plan.
EPA's current Strategic Plan defines key goals for the Agency over the next five years. Under these goals, there are specific sub-objectives and strategic targets that define, in measurable terms, the environmental change to be accomplished. For the NEP, this target is the number of acres of habitat protected or restored within their study areas.
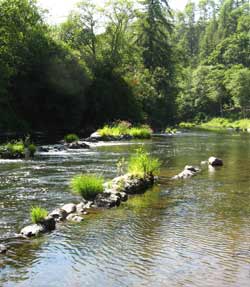
The NEPs report the number of habitat acres they have protected and/or restored with their partners annually to EPA. These reports provide a description of the project (with photos if available), specify the habitat type or category, indicate the protection activity/restoration technique associated with the project, and identify the lead implementer along with some other data.
The most current information (2010 - present) is accessible by going to NEPmap. To view a pie chart of the NEP annual habitat acre totals by habitat type since 2000, please see below.
National Results
- Learn more about Habitat loss and degradation
- Review examples of NEP habitat plans
- Learn about reporting environmental results
View NEP financing strategies and total primary leveraged dollars. Leveraged dollars are defined as the dollar value (cash or in-kind equivalent) of resources dedicated to implementing an NEP Comprehensive Conservation and Management Plan (CCMP) above the funding provided to the NEP under Section 320, including earmark funding.
View successful financing mechanisms being used by NEPs.
Progress Through Partnerships
The NEPs have made substantial progress in protecting and restoring habitats in their estuaries. The habitat efforts carried out by the NEPs and their partners have yielded measurable environmental results. Not only do these projects improve coastal habitats directly, but also indirectly. Improvements in the water quality in these estuaries, their wetlands, and rivers and streams also benefit birds, shellfish and other species living there.
The habitat protection efforts reported here are coordinated and reported by the NEPs. However, they were accomplished through the efforts of the many individual state, local and federal partners that comprise each estuary program. These stakeholders have committed significant time and resources to support habitat-related Comprehensive Conservation and Management Plan (CCMP) actions.
These CCMP actions serve as the basis of the acreage numbers reported. Through strong partnerships and collective efforts, NEPs are able to address habitat loss and alteration, and the broad range of problems facing coastal communities and our estuaries.
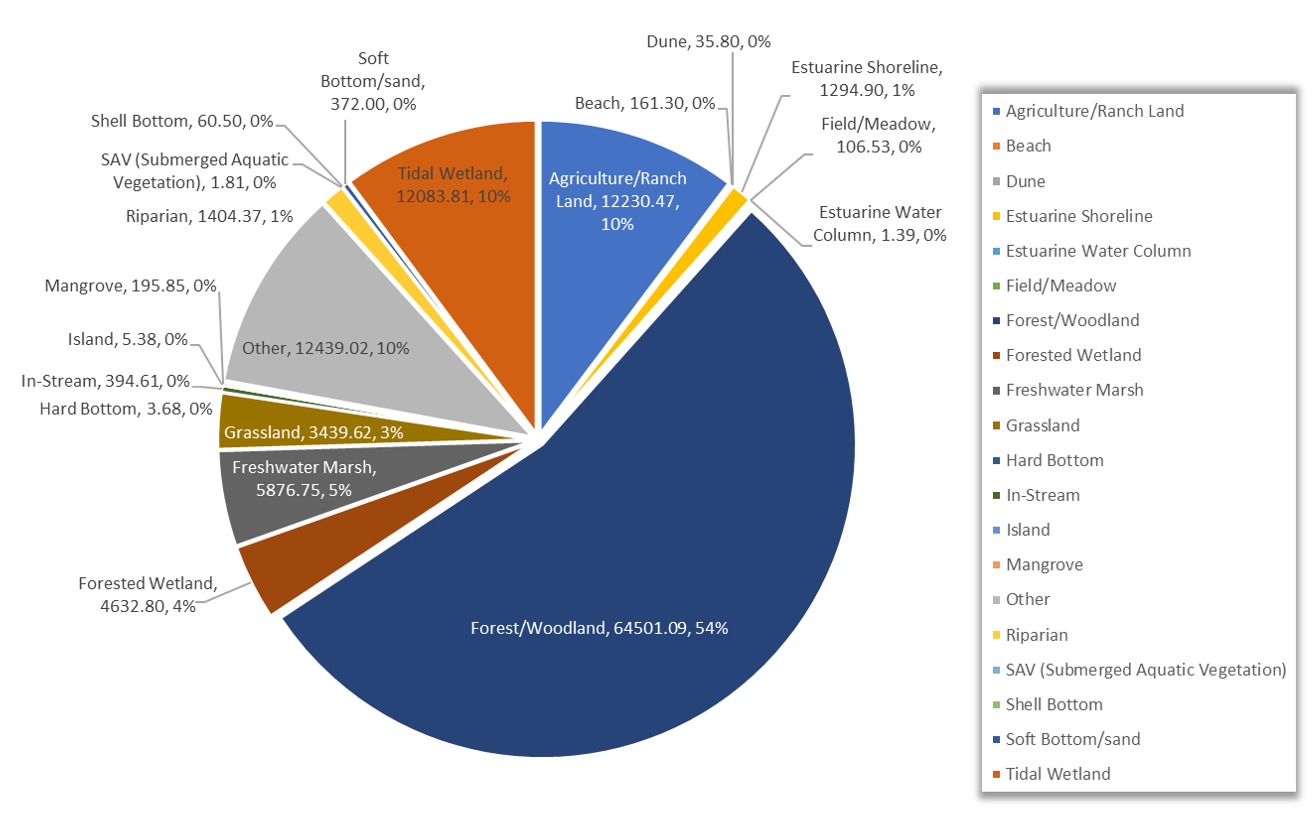
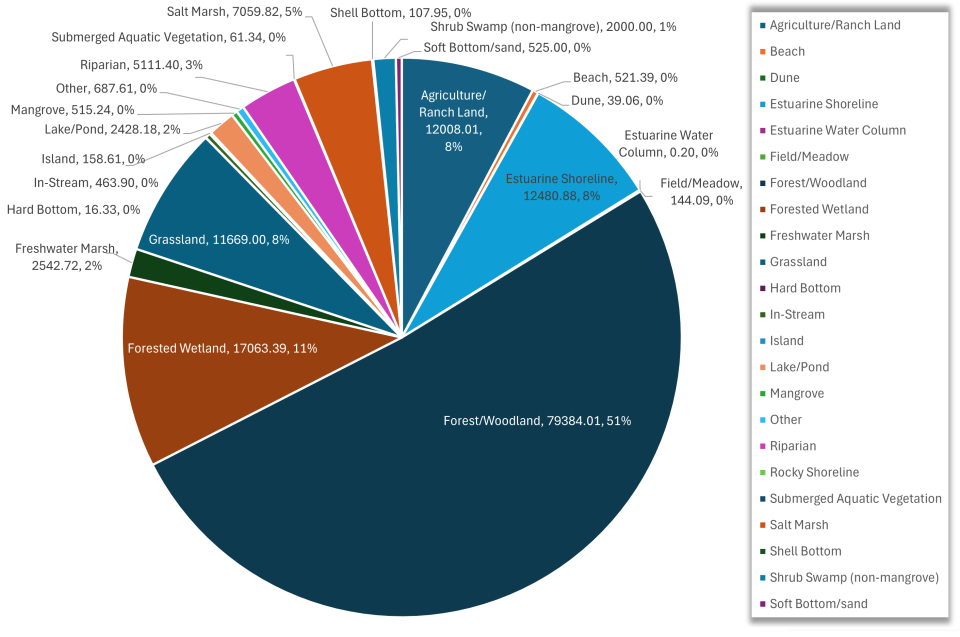
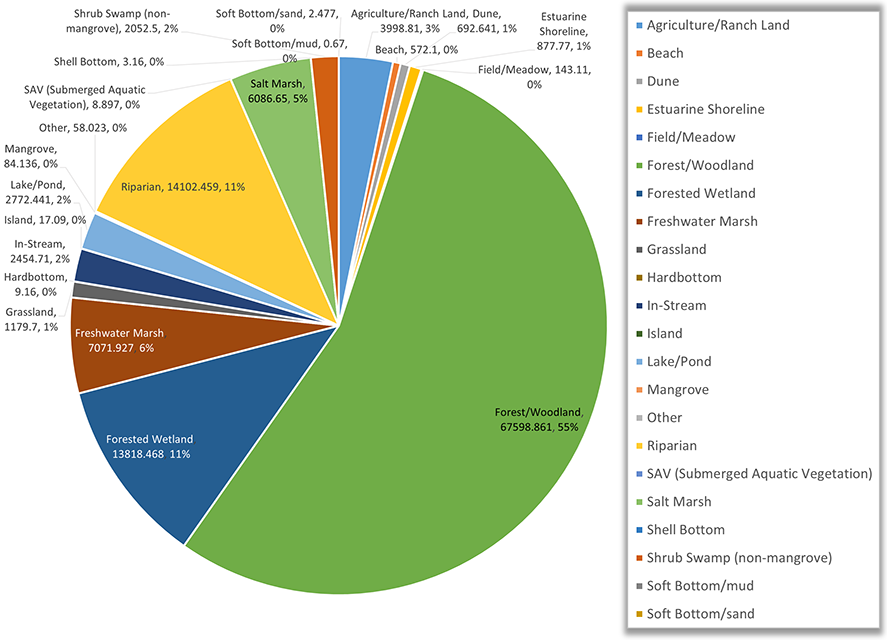
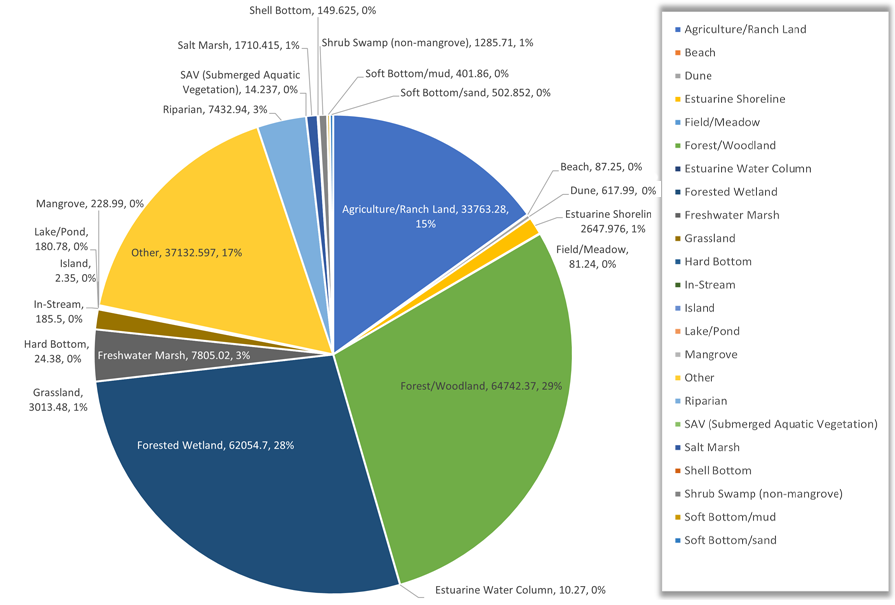
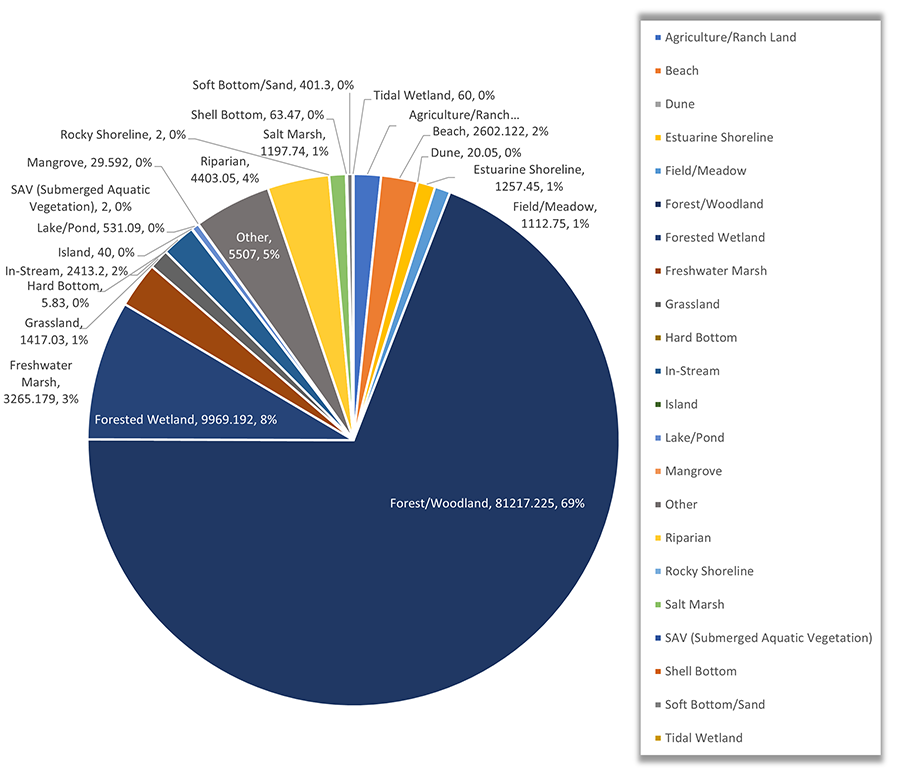
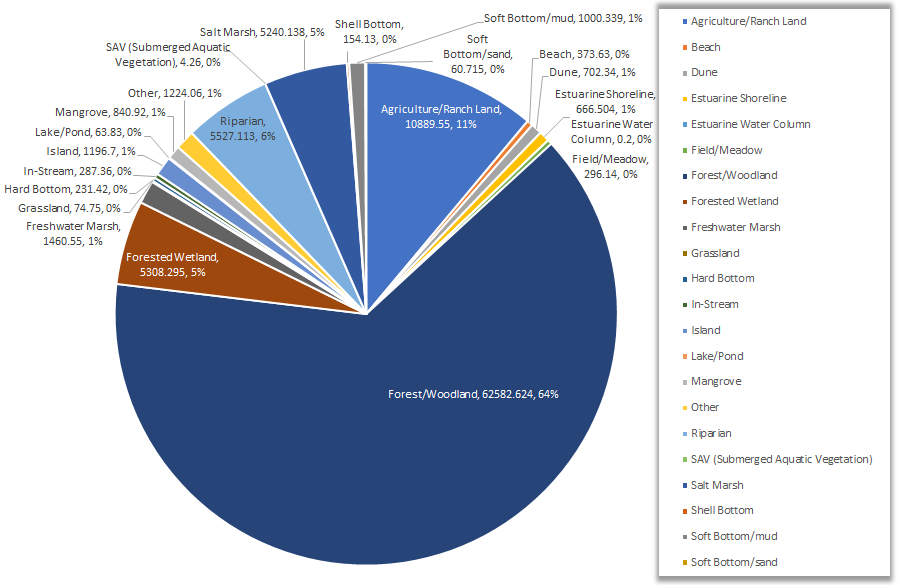
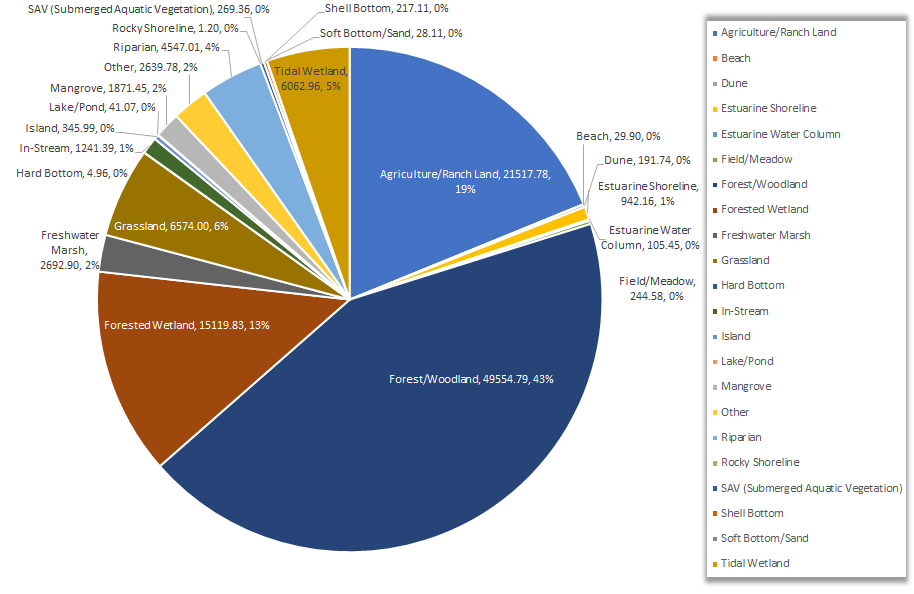
Annual National Estuary Program Habitat Totals
The NEPs have restored or protected over 2.5 million acres since 2000. Annual acreage numbers vary due to many factors. These factors include funds available, weather conditions, negotiations with land owners, length of time to get a permit and availability of plant materials. To see national results prior to 2019, please visit the 2000 to 2018 Habitat Efforts page.
Total Year 2025 Habitat Efforts
Total Year 2024 Habitat Efforts
Total Year 2023 Habitat Efforts
Total Year 2022 Habitat Efforts
Total Year 2021 Habitat Efforts
Total Year 2020 Habitat Efforts
Total Year 2019 Habitat Efforts