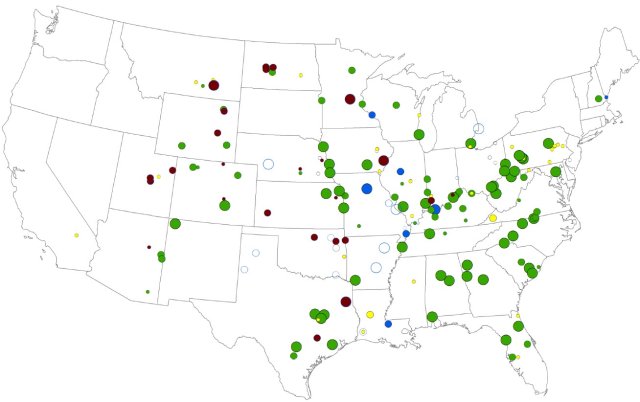
Latest Emission Comparisons & Pollution Controls
On this page:
- Quarterly Data: 2023 vs. 2024 (Quarters 1, 2, 3, and 4)
- Annual Data: 2023 vs. 2024
- Ozone Season Data: 2023 vs. 2024
- Facility Level Emission Changes: 2009 vs. 2024
- Coal-fired Characteristics and Controls: 2024
- Changes in Control Technologies at Coal-Fired Units: 2000-2024
EPA regularly posts updates of quarterly sulfur dioxide (SO2), nitrogen oxides (NOx), carbon dioxide (CO2), and mercury (Hg) emissions data from power plants subject to the Acid Rain Program, the Cross-State Air Pollution Rule (CSAPR), CSAPR Update, Revised CSAPR Update, and the Mercury and Air Toxics Standards (MATS) to make it easy for the public to track changes in emissions from these sources. All of the data presented here are also available in Clean Air Markets Program Data (CAMPD). More summary level data is available in our Progress Reports and also in our Power Plant Emission Trends.
Quarterly Data: 2023 vs. 2024 (Quarters 1, 2, 3, and 4)
The data presented here compare emissions, emission rates, and heat input from power plant units in the Acid Rain Program, CSAPR, CSAPR Update, Revised CSAPR Update, and MATS. This file compares quarterly emission data from 2023 with data for the same quarters from 2024.
Power plant emissions data for all four quarters of 2024 are mostly flat compared to the 2023 data, with the large decreases from 2022 and previous years largely maintained:
- 1 percent increase for NOX
- 7 percent decrease for SO2
- 0 percent change for CO2
- 7 percent decrease for Hg
Overall, the changes were due to small increases in demand as well as changes in the mix of fossil generation. Total fossil generation increased by 2 percent in 2024 compared to 2023 while coal generation decreased by 3 percent, reflecting increases in total generation (fossil and non-fossil) observed across the fleet.
Annual Data: 2023 vs. 2024
The data presented here compare emissions, emission rates, and heat input from power plant units in the Acid Rain Program, CSAPR, CSAPR Update, Revised CSAPR Update, and MATS. These files compare annual emission data from 2023 with 2024.
- 2024 Emissions Data Fact Sheet (pdf)
- Table of Annual Emissions, Emission Rates, Heat Input: 2023 vs. 2024 (xlsx)
Ozone Season Data: 2023 vs. 2024
The data presented here compare emissions, emission rates, and heat input from power plant units in the Acid Rain Program, CSAPR, CSAPR Update, Revised CSAPR Update, and the Good Neighbor Plan (administratively stayed in October 2024). These files compare ozone season (May 1 – Sept 30) emission data from 2023 and 2024.
Compared with the 2023 ozone season, ozone season emissions in 2024 showed a 3% decrease nationwide.
Overall, the changes were due to small increases in demand as well as changes in the mix of fossil generation. Total fossil generation increased by 1 percent in the 2024 ozone season compared to 2023 while coal generation decreased by 3 percent.
Facility Level Emission Changes: 2009 vs. 2024
The data presented here compare emissions and emission rates from power plants in the Acid Rain Program, CSAPR, CSAPR Update, and Revised CSAPR Update. These files compare longer-term annual data at the facility level.
Coal-fired Characteristics and Controls: 2024
The data presented here provide detailed information about coal-fired power plants, including emissions of SO2, NOX, and CO2; heat input; capacity; on-line year; and emission controls.
Changes in Control Technologies at Coal-Fired Units: 2000-2024
The following figures display where particular control technologies have been installed between 2000 and 2024 based on the information obtained from major company contacts and industry sources.

