U.S. flag

An official website of the United States government

Here’s how you know

Dot gov

Official websites use .gov
A .gov website belongs to an official government organization in the United States.

HTTPS

Secure .gov websites use HTTPS
A lock (LockA locked padlock) or https:// means you’ve safely connected to the .gov website. Share sensitive information only on official, secure websites.

    • Environmental Topics
    • Air
    • Bed Bugs
    • Cancer
    • Chemicals, Toxics, and Pesticide
    • Emergency Response
    • Environmental Information by Location
    • Health
    • Land, Waste, and Cleanup
    • Lead
    • Mold
    • Radon
    • Research
    • Science Topics
    • Water Topics
    • A-Z Topic Index
    • Laws & Regulations
    • By Business Sector
    • By Topic
    • Compliance
    • Enforcement
    • Laws and Executive Orders
    • Regulations
    • Report a Violation
    • Environmental Violations
    • Fraud, Waste or Abuse
    • About EPA
    • Our Mission and What We Do
    • Headquarters Offices
    • Regional Offices
    • Labs and Research Centers
    • Planning, Budget, and Results
    • Organization Chart
    • EPA History

Breadcrumb

  1. Home
  2. Regional Monitoring Networks (RMNs)

Regional Monitoring Networks - Streams

  • Stream RMNs
  • Protocols
  • Site selection criteria
  • Data management
  • Data analysis
  • Publications

Stream RMNs

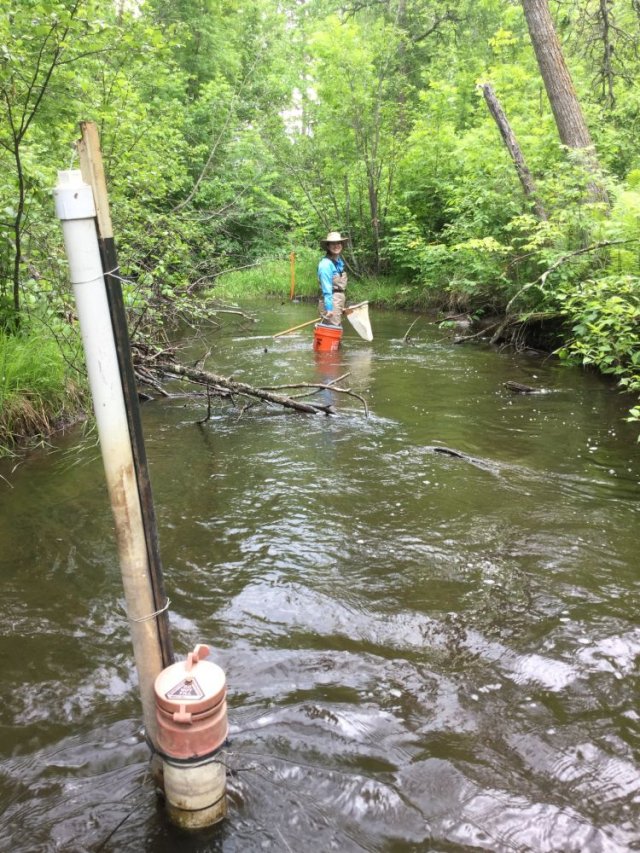
RMNs exist in the Northeast, Mid-Atlantic, Southeast, and Midwest regions of the United States (Figure 1). Efforts are expanding into other regions. . RMN sites monitor water quality, stream flow parameters, and biological indicators of aquatic ecosystem health. 

Mud Stream - Regional Monitoring Networks - Kansas
Wadeable stream RMNs build on existing state and tribal bioassessment efforts, with the goal of collecting comparable data at a limited number of sites. 

Stream protocols

Use of consistent and comparable methods at RMN sites is important, because different sampling protocols introduce biases in analyses and contribute to variability in results. Variation introduced by different sampling regimens increases the noise-to-signal ratio, requiring more samples over time to detect trends. We strive to achieve as much consistency within and across RMN regions as possible. For some indicators like stream macroinvertebrates, however, methods sometimes differ with habitat (e.g., silt versus gravel bottoms, riffles versus deeper reaches).

The RMN framework allows for different levels of effort to maximize participation. There are four levels of effort for each indicator, from 1 as the minimum level to 4 as the ‘highest’ level (Tables 1, 2, and 3). Participants are encouraged to collect as many of the indicators as possible at level 3 or above. That approach increases the likelihood of detecting trends over shorter time periods and increases the utility the data. If participants are unable to collect the full set of parameters, they can select the options that best fit their priorities. They can work towards participating at a higher level as resources permit. Phased approaches are common, where RMN partners add more parameters (and potentially sites) as they gain experience and build capacity.

Table 1. Recommendations on best practices for collecting macroinvertebrate data at Northeast, Mid-Atlantic and Southeast Stream RMN) sites. The RMN framework has four levels of rigor for macroinvertebrate sampling, with 4 being the best/highest and 1 being the lowest. At primary RMN sites, RMN partners should try to adhere to (at a minimum) the Level 3 practices.
Component 1 (lowest) 2 3 4 (highest)
Sampling frequency Site is sampled every 5 or more years Site is sampled every 2−4 years Site is sampled annually Site is sampled more than once
a year (e.g., spring and summer)
Habitat No riffle habitat Multihabitat composite from a sampling reach with scarce riffle habitat Abundant riffle habitat Multihabitat sample with taxa from each habitat kept separate
Time period Time period varies from year to year, and adjustments are NOT made for temporal variability Time period varies from year to year, but adjustments are made for temporal variability Adherence to a single time period for sampling Samples are collected during more than one time period (e.g., spring and late summer/early fall)
Fixed count subsample Presence/absence or field estimated categorical abundance (e.g., rare, common, abundant, dominant) Fixed count with a target of 100 or 200 organisms Fixed count with a target of 300 organisms Fixed count with a target of more than 300 organisms
Processing Organisms are sorted, identified and counted in the field by trained individuals Samples are processed in the laboratory by trained individuals. Some but not all methods for sample processing were accepted by the regional working group Samples are processed in the laboratory by trained individuals and use methods that are agreed upon by the regional working group Samples are processed in the laboratory by trained individuals and use methods that are more stringent than those being used by the regional working group
Sorting efficiency No checks on sorting efficiency Sorting efficiency checked internally by a trained individual Sorting efficiency checked internally by a taxonomist Sorting efficiency checked by an independent laboratory
Qualifications Identifications are done by a novice or apprentice biologist with no certification Identifications are done by an experienced taxonomist without certification Identifications are done by a trained taxonomist who has an appropriate level of certification Identifications are done by a certified taxonomist who is recognized as an expert in species-level taxonomy for one or more groups
Taxonomic resolution Coarse resolution (e.g., order/family) Mix of coarse and genus-level resolution (e.g., family-level Chironomidae, genus-level Ephemeroptera, Plecoptera, and Trichoptera [EPT]) Mix of species and genus level. Identifications are done to the level of resolution specified in Appendix G Species level for all taxa, where practical
Validation No validation Taxonomic checks are performed internally. The entire subsample (referred to as a “voucher sample”) is retained for each site. Taxonomic checks are performed internally. The entire subsample (referred to as a “voucher sample”) is retained for each site as well as a reference collection with each unique taxon Taxonomic checks are performed by an independent laboratory. The entire subsample (referred to as a “voucher sample”) is retained for each site, as well as a reference collection with each unique taxon verified by an outside expert

Expectations for data collection and best practices are described in the Stream RMN report (USEPA 2016) and Best Practices for Continuous Monitoring of Temperature and Flow in Wadeable Streams (USEPA 2014). 

Table 2. Recommendations on best practices for collecting temperature data at Stream RMN sites. The RMN framework has four levels of rigor for temperature monitoring, with 4 being the best/highest and 1 being the lowest. At primary RMN sites, partners should try to adhere to (at a minimum) the Level 3 practices.

Component 1 (lowest) 2 3 4 (highest)
Equipment No temperature sensors Water temperature sensor only Air and water temperature sensors Air temperature sensor plus multiple water temperature sensors to measure stream reach-scale variability
Period of record Single measurement/s taken at time of biological sampling event Continuous measurements taken seasonally (e.g., summer only) at intervals of 90 minutes or less Continuous measurements taken year-round at 30-minute intervals Continuous measurements taken year-round at intervals of less than 30 minutes
Radiation shield Not installed Installed; the shield is made using an untested design (its effectiveness has not been documented) Installed; the shield is made using a design for which some level of testing has determined its effectiveness Installed; the shield is made using a design that has been tested year-round and under a range of canopy conditions
QA/QC―sensor accuracy No accuracy checks performed No accuracy checks performed Predeployment accuracy check is performed, along with any other QA/QC checks that are agreed upon by the regional working group Predeployment accuracy check, and checks following initial deployment, mid-deployment, biofouling, and postdeploymenta

aFor more details, see the QAPP (U.S. EPA, 2016. Generic Quality Assurance Project Plan for monitoring networks for tracking long-term conditions and changes in high quality wadeable streams).

EPA also developed a Quality Assurance Project Plan (QAPP) that details the core requirements for participation in an RMN. It outlines best practices for the collection of biological, thermal, hydrological, physical habitat, and water chemistry data at RMN sites. The QAPP is transferable across regions, with region-specific information included in the following attachments:

  • Attachment A – site and signature page
  • Attachment B – lead personnel and scoping meetings
  • Attachment C – template for biological protocols 

RMN partners developed protocols documents for specific parameters:

  • Macroinvertebrates
  • Fish
  • Periphyton
  • Continuous temperature
  • Continuous hydrology
  • Water chemistry
  • Habitat
  • Time lapse cameras
     
Table 3. Recommendations on best practices for collecting hydrologic data at regional monitoring network (RMN) sites. The RMN framework has four levels of rigor for hydrologic monitoring, with 4 being the best/highest and 1 being the lowest. At primary RMN sites, RMN members should try to adhere to (at a minimum) the Level 3 practices.
Component 1 (lowest) 2 3 4 (highest)
Equipment Pressure transducer, water only; no staff gage Pressure transducer, water and air (encased in housings); no staff gage Pressure transducer, water and air (encased in housings); staff gage installed Same as Level 3, plus a precipitation gage or USGS gage
Type of data Stage/water level only; data are not corrected for barometric pressure Stage/water level only; data are corrected for barometric pressure Stage/water level corrected for barometric pressure. Also, a minimum of 5−10 discharge measurements are taken under a variety of flow conditions to develop a stage-discharge rating curve, which is used to convert water level to flow/discharge Stage/water level corrected for barometric pressure. In addition, 10 or more discharge measurements that capture the full range of flow conditions are taken to develop a stage-discharge rating curve, which is used to convert water level to flow/discharge.
Period of record Discharge measurements taken with flow meter at time of biological sampling event Continuous measurements taken seasonally (e.g., summer only) Continuous measurements taken year-rounda Continuous measurements taken year-rounda
Elevation survey Not performed Performed once, at time of installation Performed annually Performed more than once a year, as needed (e.g., if a storm moves the sensor and it has to be redeployed)
QA/QC―sensor accuracy No accuracy checks are performed No accuracy checks are performed At least once annually, field crews take a staff gage reading or water depth measurement over the transducer with a stadia rod or other measuring device and compare this to the sensor reading Multiple times per year, field crews take a staff gage reading or water depth measurement over the transducer with a stadia rod or other measuring device and compare this to the sensor reading
QA/QC―stage-discharge rating curve After the rating curve is established, no checks are performed to verify the stage-discharge rating curve After the rating curve is established, no checks are performed to verify the stage-discharge rating curve After the rating curve is established, discharge is measured at least once annually to verify the stage-discharge rating curve, and if possible, also after large storms or any other potentially channel-disturbing activities After the rating curve is established, discharge measurements are taken quarterly to verify the stage-discharge rating curve, and if possible, also after large storms or any other potentially channel-disturbing activities
QA/QC― discharge No discharge checks are performed No discharge checks are performed Periodically, duplicate discharge measurements are taken, ideally by different peopleb Periodically, duplicate discharge measurements are taken, ideally by different people. Discharge measurements are also periodically compared to a standard, such as a real-time USGS gage, or to measurements obtained by an experienced hydrographer from the USGS or another agency.

aIn places where streams become completely frozen during the winter, pressure transducers may be removed during winter months if freezing will result in damage to the equipment.
bFor more details, see the QAPP (U.S. EPA, 2016. Generic Quality Assurance Project Plan for monitoring networks for tracking long-term conditions and changes in high quality wadeable streams).

Stream RMN regions
(Click on the image to view a larger version of it) 
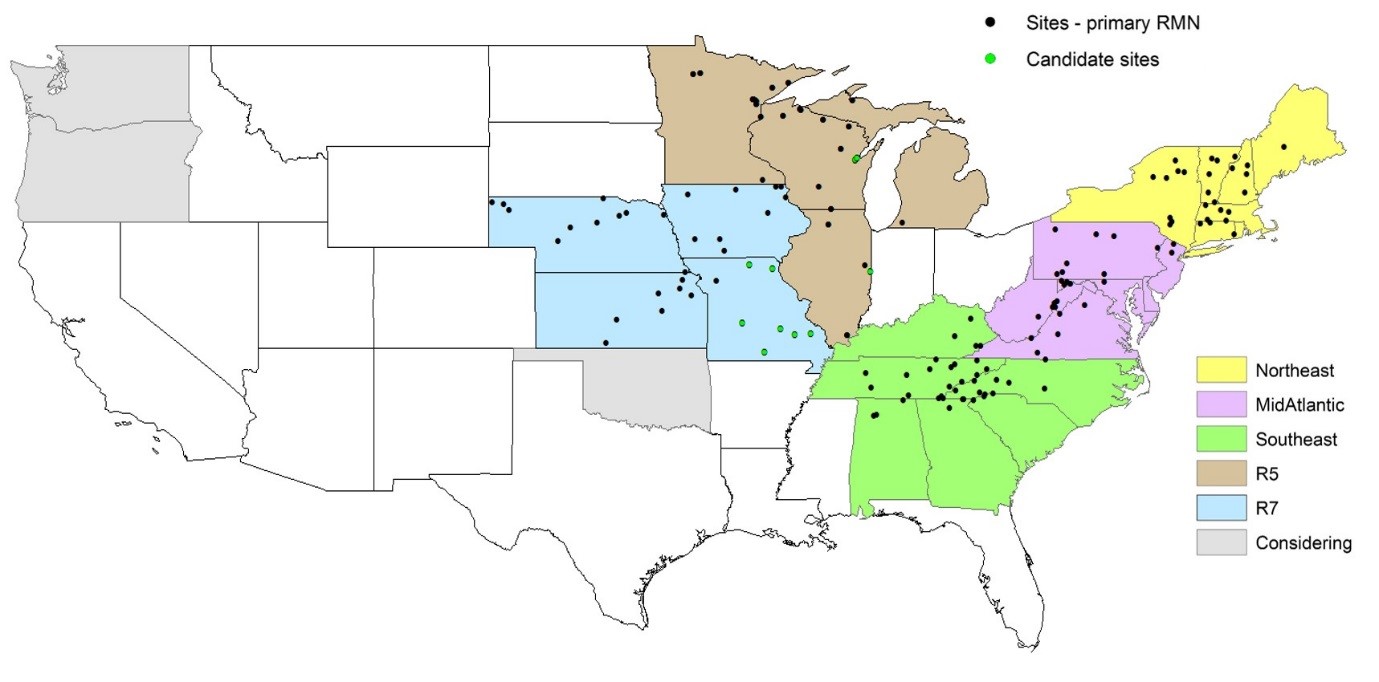
Figure 1. Stream RMN regions

Stream site selection criteria

Sampling efforts at the RMNs are concentrated at a core group of sites called ‘primary’ sites, where as many of the recommended parameters as possible are collected using the RMN protocols (Figure 1). There are also ‘secondary’ sites in the RMNs at which data for a subset of parameters are collected as part of other independent monitoring efforts. Data from secondary sites increase the sample size and range of conditions represented in the RMN data set. They also can capture gradients of interest such as level of development (pristine to severely degraded).

Photo of the Regional Monitoring Network team working on the bank of a stream.
The number of sites sampled by each participating entity in the stream RMNs varies (currently it ranges from 1 to 15). Based on power analyses that were conducted during the design of the stream RMNs, a total of 30 sites per EPA Region is the target. (see Appendix A in Regional Monitoring Networks (RMNs) to Detect Changing Baselines in Freshwater Wadeable Streams (EPA/600/R-15/280)). Select sites should have as many of the desired characteristics listed in Table 4 as feasible. The process to screen sites is described in the USEPA (2017) report “Procedures for Delineating and Characterizing Watersheds for Stream and River Monitoring Programs” and uses data from StreamCat (Hill et al. 2016) and the Index of Watershed (IWI) and Index of Catchment Integrity (ICI) (Thornbrugh et al. 2017). The RMN Tools page describes the screening process and selection criteria, including level of anthropogenic disturbance and stream classification 

Classification ensures that everyone has a clear understanding of what stream types are sampled. From an analytical standpoint, stream classification allows a network to identify stream reaches for which parameter values are expected to be similar. In the Northeast, the RMN classified streams into four types by macroinvertebrate data and stream size and slope. See Regional Monitoring Networks (RMNs) to Detect Changing Baselines in Freshwater Wadeable Streams (EPA/600/R-15/280), Appendix A.  Since that time, EPA has analyzed benthic community composition in parts of all three eastern regions (Northeast, Mid-Atlantic, and Southeast) and found stream size and slope to be important predictors. Table 4 lists the main considerations for site selection. 

Table 4. Main considerations when selecting primary sampling sites for the regional monitoring networks (RMNs)
Consideration Desired characteristics at primary sites
Existing monitoring network Located in established monitoring network(s).
Sites with lengthy historical sampling records are preferred.
Disturbance Low level of anthropogenic disturbance is preferred 
  • Minimally disturbed sites are the standard against which other sites are compared; shifts in measured parameters over time should be examined for possible changing environmental conditions.
  • Minimally disturbed sites help understand natural variability.
  • Minimally disturbed sites help fill data gaps (long-term biological, thermal and hydrologic data from minimally disturbed sites are limited)
Potential for future disturbance Watersheds that are protected from future development are preferred for primary sampling sites.
Accessibility Multiple site visits per year should be possible (e.g., day trip).
Equipment Consider co-locating with existing equipment (e.g., USGS gage) where feasible. If sites do not have equipment, consider their suitability for installation of continuous sensors.
Broad-scale classification Sites exhibit similar environmental characteristics.
Shared workload Use opportunities to partner with outside agencies or organizations.
Significance Consider highly valued site (e.g., has ecological or cultural significance)

EPA NRSA and NLA aggregated ecoregions

Managing both discrete and continuous data collected from RMN sites is similar across the different types of RMNs and is described on a separate Data Management page. The Data Analysis page describes how RMN data are analyzed, summarized, and visualized to explore a variety of endpoints. 

Regional Monitoring Networks (RMNs)

  • RMNs Home
  • RMNs Background
  • RMNs Tools
  • Lake RMNs
  • Stream RMNs
  • Wetland RMNs
  • Data Analysis
  • Data Management
  • Publications and Resources
Contact Us About Regional Monitoring Networks (RMNs)
Contact Us to ask a question, provide feedback, or report a problem.
Last updated on January 21, 2025
  • Assistance
  • Spanish
  • Arabic
  • Chinese (simplified)
  • Chinese (traditional)
  • French
  • Haitian Creole
  • Korean
  • Portuguese
  • Russian
  • Tagalog
  • Vietnamese
United States Environmental Protection Agency

Discover.

  • Accessibility Statement
  • Budget & Performance
  • Contracting
  • EPA www Web Snapshot
  • Grants
  • No FEAR Act Data
  • Plain Writing
  • Privacy
  • Privacy and Security Notice

Connect.

  • Data
  • Inspector General
  • Jobs
  • Newsroom
  • Regulations.gov
  • Subscribe
  • USA.gov
  • White House

Ask.

  • Contact EPA
  • EPA Disclaimers
  • Hotlines
  • FOIA Requests
  • Frequent Questions
  • Site Feedback

Follow.