
Redevelopment Economics at Superfund Sites
On this page:
- Basic Information
- National Beneficial Effects
- Regional Economic Profiles
- Beneficial Effects Economic Case Studies
- Information about Site-Specific Economic Highlights
The Redevelopment Economics at Superfund Sites Interactive StoryMap highlights the national economic benefits associated with site reuse and summarizes the different ways that EPA shares that information with the public:
Basic Information

For over three decades, EPA’s Superfund program and its partners have remediated contaminated hazardous waste sites and furthered community goals for reuse. Communities reuse Superfund sites in many ways – parks, shopping centers, athletic fields, wildlife sanctuaries, manufacturing facilities, residences, roads and more.
Many reuse outcomes can play a role in economically revitalizing a community. EPA measures the economic beneficial effects of reuse at Superfund sites by collecting the following types of information:
- Number of businesses located on site.
- Number of people employed at site businesses.
- Annual employment income from on-site jobs.
- Annual sales revenue generated by businesses on site.
- On-site property value and property tax information.
- Other economic impacts that are unique to specific sites.
SRP tracks these figures from year to year, to give a general overview of the national beneficial effects associated with Superfund redevelopment:
SRP compiles Regional Economic Profiles to track the economic effects and benefits to the community at a region-wide scale.
SRP writes Beneficial Effects Economic Case Studies that allow for a site-specific approach to gathering more complete information related to reuse, employment and other economic impacts.
EPA has created a postcard that highlights the economic benefits of site reuse:
EPA has created a Superfund Redevelopment Economics Notebook that provides a general overview of EPA’s efforts to quantify some of the economic benefits associated with the cleanup and reuse of Superfund sites.
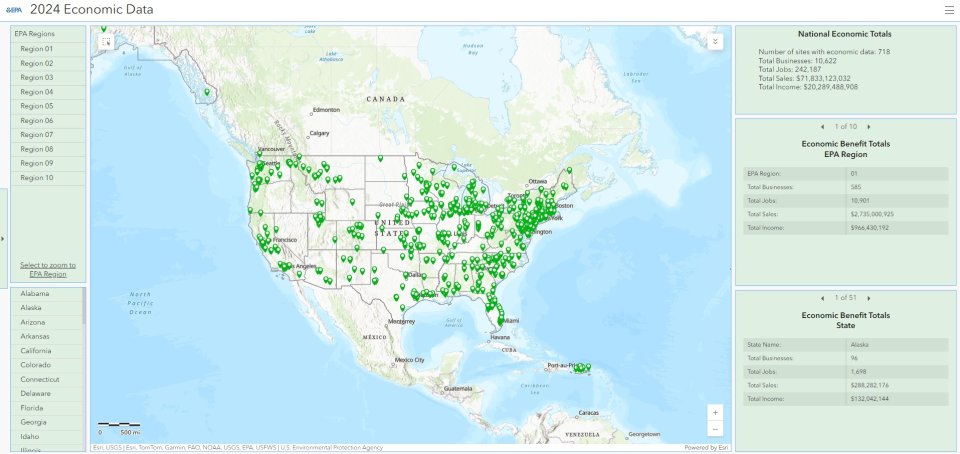
EPA has created a Compendium of 2024 Economic Data that highlights and summarizes the economic benefits associated with the cleanup and reuse of Superfund sites nationally and at the EPA Region and state level.
National Beneficial Effects
Innovative businesses and organizations reuse Superfund sites for a variety of purposes. Some uses play a role in economically revitalizing communities. The EPA estimated the national economic beneficial effects of Superfund sites in reuse between 2011 and 2024. In 2024, 718 Superfund sites had economic data available, representing only a percentage of all sites in reuse and excluding federal facilities. The remaining non-federal facility sites in reuse and continued use are not expected to have uses that support on-site businesses, provide jobs or generate sales revenue. In 2024, the EPA had economic data for 10,622 businesses. These businesses generate $71.8 billion in annual sales revenue and employ 242,187 people who earn a combined estimated annual income of $20.3 billion.
| Estimates of National Beneficial Effects Since 2011 | |||||
|---|---|---|---|---|---|
| Year | Sites in Reuse with Economic Data | Number of Businesses | Annual Sales* | Jobs | Annual Employment Income* |
| 2011 | 135 | 271 | $12.3 billion | 24,308 | $2.3 billion |
| 2012 | 276 | 972 | $27.3 billion | 46,475 | $4.5 billion |
| 2013 | 363 | 2,216 | $43.9 billion | 70,270 | $6.6 billion |
| 2014 | 450 | 3,474 | $41.7 billion | 89,646 | $8.0 billion |
| 2015 | 454 | 3,908 | $38.4 billion | 108,445 | $10.3 billion |
| 2016 | 458 | 4,720 | $44.4 billion | 131,635 | $12.0 billion |
| 2017 | 487 | 6,622 | $55.8 billion | 156,352 | $14.3 billion |
| 2018 | 529 | 8,690 | $65.5 billion | 195,465 | $16.6 billion |
| 2019 | 602 | 9,188 | $71.5 billion | 208,468 | $17.7 billion |
| 2020 | 632 | 9,902 | $76.7 billion | 227,769 | $19.7 billion |
| 2021 | 650 | 10,230 | $76.2 billion | 246,178 | $21.5 billion |
| 2022 | 671 | 10,253 | $79.5 billion | 236,802 | $19.9 billion |
| 2023 | 692 | 10,261 | $73.5 billion | 237,054 | $19.4 billion |
| 2024 | 718 | 10,622 | $71.8 billion | 242,187 | $20.3 billion |
| *Adjusted to 2024 U.S. dollars (USD) using the Consumer Price Index (CUUR0000SA0, not seasonally adjusted, U.S. city annual average). | |||||
Readily available internet and database sources are utilized to create estimates of national totals related to the beneficial effects of Superfund sites in reuse. Without more extensive research it is not always possible to identify all business names and addresses on site.
Jobs are not the only way communities benefit when Superfund sites are cleaned up. A 2009 report provides an overview of how cleaning up sites may benefit home prices:
Regional Economic Profiles

SRP has developed regional economic profiles that tell a story about the role of Superfund in each EPA region and the beneficial effects of reusing formerly contaminated properties. These reports summarize economic data collected for Superfund sites within an EPA region. They also highlight successes and put them in the context of aggregated data within the state and EPA region. Economic data are updated annually; regions receive a full regional economic profile or a data supplement to update the prior year’s full regional economic profile on alternate years.
- Region 1 (2023 Data) (PDF)
- Region 2 (2023 Data) (PDF)
- Region 3 (2023 Data) (PDF)
- Region 4 (2023 Data) (PDF)
- Region 5 (2023 Data) (PDF)
- Region 6 (2022 Data) (PDF)
- Region 7 (2024 Data) (PDF)
- Region 8 (2022 Data) (PDF)
- Region 9 (2022 Data) (PDF)
- Region 10 (2022 Data) (PDF)
Beneficial Effects Economic Case Studies
A beneficial effects economic case study gathers more complete information related to reuse, employment and other beneficial effects. While national impact estimates may underestimate jobs, a local beneficial effects case study can obtain detailed information about economic benefits for every company present on the site, in addition to unique economic benefits provided by particular uses, such as alternative energy.
Each beneficial effects economic case study includes a technical appendix that provides an overview of the approaches, assumptions and methodologies used to obtain estimates on local beneficial effects.
Additional case studies can be found on the Superfund Redevelopment Case Studies page:
Information about Site-Specific Economic Highlights
The reuse of Superfund sites provides a wide range of benefits to local communities across the country. Some of these benefits are easy to quantify, while others are not. For example, commercial or industrial reuse of a site can bolster local economies by supporting jobs and generating sales revenues. However, not all sites in reuse involve an on-site business or other land use that would employ people. Therefore, economic information is not available for all sites in reuse. This could be attributed to several factors, including:
- There may be no revenue-generating businesses operating on site.
- There may be a business or businesses operating on site for which economic information is not available.
- In some cases, due to the large footprint of a site, it is not feasible to collect economic information for such a large area (i.e., an entire town). In these cases, a site reuse snapshot may discuss widespread site reuse, but economic information may not be available for the site.
- Due to a time lag between when site reuse snapshots are updated and when economic information is updated annually, it is possible that economic research may not be performed to capture new reuse mentioned in a snapshot until after the snapshot has been updated.
Many sites without businesses have beneficial effects that are not easily quantified, such as properties providing ecological or recreational benefits (e.g., parks, wetlands, ecological habitat, open space). Also, not all sites in reuse are well-suited for revenue-generating reuse. If a site is not located in an area appropriate for commercial or industrial reuse, it may not be a realistic option to have it redeveloped into something that will support jobs. EPA’s Superfund Redevelopment Program quantifies many types of beneficial effects of reuse at Superfund sites including the number of on-site jobs, estimated annual employment income and sales revenue generated by on-site businesses.
EPA obtains economic data for sites in reuse from reputable sources. Information on the number of employees and sales volume for on-site businesses typically comes from the Hoovers/Dun & Bradstreet database. When Hoovers/D&B database research is not able to identify employment and sales information for on-site businesses, EPA uses the Manta and Reference Solutions databases. These databases include data reported by businesses. Accordingly, some reported values might be underestimates or overestimates. In some instances, business and employment information come from local newspaper stories/articles and discussions with local officials and business representatives. In general, economic information gathered for sites in reuse is conservative, based on available resources. In some cases, especially for exceptionally large sites, the economic information presented may not be comprehensive of the entire site, presenting a conservative estimate of the economic benefits of reuse at the given site.