
Tijuana River Watershed Technical Evaluation of Infrastructure Solutions
Technical Evaluation of Potential Infrastructure Solutions
The technical evaluation of potential infrastructure solutions to mitigate contaminated transboundary Tijuana River and coastal flows began in August 2020. This technical evaluation included two steps, Project Feasibility Analysis and Alternatives Analysis. Click on the links for a more in-depth overview of the two-step process:
- Step 1: Project Feasibility Analysis (August 2020 - May 2021)
- Step 2: Alternatives Analysis (June - October 2021)
Step 1: Project Feasibility Analysis
EPA completed Step 1 of the technical evaluation in May 2021. Incorporating stakeholder input, EPA evaluated an initial ten projects with potential to address the public health and environmental concerns caused by transboundary flows into the United States from the Tijuana River and Pacific Ocean. The analysis evaluated all ten projects, subsequently narrowed to eight due to feasibility concerns, to determine their ability to reduce environmental and human health impacts from these transboundary flows. The evaluation considered each project’s feasibility, cost of construction, and operations and maintenance costs to inform next steps.
The figure below shows the location of existing infrastructure that provided the basis for defining the initial ten projects as well as the regions and areas that are affected by the transboundary flows.
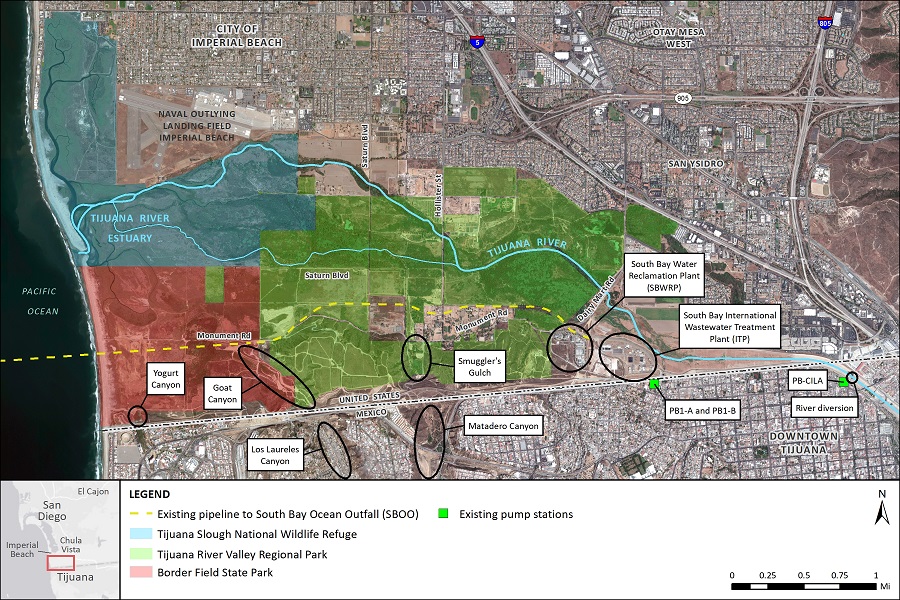
Broadly, projects focused on three types of interventions:
- Conveyance projects evaluate the construction or repair of the infrastructure (e.g., pipes, pumps) that convey wastewater to treatment and disposal facilities.
- Treatment projects increase facility capacity to treat wastewater, remove pollutants, and put clean water back into waterways and waterbodies.
- Source Control projects intervene at the source of contamination to stop or reduce pollutants before reaching a waterbody or treatment facility.
The initial ten projects covered a range of pollutants and entry points, and each focused on one or more intervention categories. Below is a list of the initial ten projects and their respective intervention focus. Each project is linked to a fact sheet and map outlining the proposed solution, as well as a feasibility analysis. Project names in the table below are consistent with the April 2020 Federal Register Notice of Intent to conduct NEPA Public Scoping and may differ from other content on the website as revisions were made to improve clarity and directness.
*ITP: South Bay International Wastewater Treatment Plant; SAB: San Antonio de los Buenos Wastewater Treatment Plant; SBWRP: City of San Diego South Bay Water Reclamation Plant
Step 2: Alternatives Analysis
- Water Infrastructure Alternatives Analysis Final Report (pdf)
- Resumen Ejecutivo del Informe Final (pdf)
- Comprehensive Alternative (I-2) Fact Sheet (pdf)
- News Releases for Comprehensive Infrastructure Solution:
Beach Impact Comparison Study
Tijuana River vs. San Antonio de los Buenos (SAB) Creek
Of the pollutants commonly found in transboundary flows, untreated wastewater, which contains harmful pathogens, poses the greatest risk to human health. To minimize human contact with untreated wastewater during transboundary flow events, local governments mandate beach closures, reducing access to fishing, swimming, surfing, other recreational activities, and tourism.
Due to public health and beach water quality concerns, Scripps Institution of Oceanography developed an estuary and ocean model to evaluate the impacts of “infrastructure solutions to improve shoreline water quality and reductions on regional beach closures.” Their work analyzed all Tijuana River and SAB Creek transboundary flows during 2017 and concluded:
- “Eliminating or dramatically reducing [wastewater flows to SAB Creek] has the strongest benefit to the City of Imperial Beach, Silver Strand State Beach, and City of Coronado.”
- In wet season the Tijuana River causes two-thirds of closures and SAB Creek one-third of closures.
- SAB Creek “is the dominant source that leads to regional beach closures” year round, and especially during the dry season (109 days during the year).
- Beach closure estimates are made based on wastewater bacteria concentrations and may not correlate with actual beach closures due to additional factors.
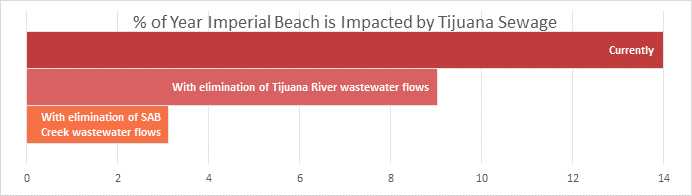
Graph is generated using Scripps Institution of Oceanography findings. Graph shows annual impacts to Imperial Beach. Similar conclusions are drawn at Playas Tijuana, Silver Strand State Beach, and Hotel del Coronado.
Source: Feddersen, F., X. Wu, and S. N. Giddings, Modeling impacts of various wastewater and stormwater flow scenarios on San Diego South Bay and Tijuana beaches, Tech. Report for the North American Development Bank, November 2020.