
Recycling Infrastructure and Market Opportunities Map
On this page:
About the Map
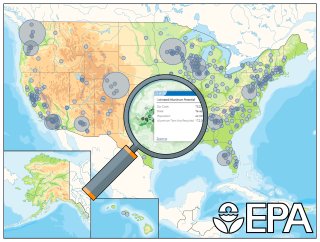
In support of the National Recycling Strategy, EPA developed an interactive map that highlights existing infrastructure, per capita generation and recycling of post-consumer material, and other relevant market factors.
By providing a comprehensive resource for understanding opportunities related to post-consumer materials management, this version of the Recycling Infrastructure and Market Opportunities Map can help develop and strengthen primary and secondary end markets for materials, and supports cleaner communities by providing opportunities to reduce the amount of plastic and other waste entering landfills. This tool visually presents data estimates from all phases of the recycling process, including generation, collection, sortation, and end use.
The map provides locations of 15 different types of recycling and other municipal solid waste infrastructure, including:
- Material recovery facilities.
- Anaerobic digesters.
- Composting facilities.
- Electronics recyclers.
- Glass recycling facilities.
- Glass secondary processors.
- Municipal solid waste landfills.
- Metals recycling facilities.
- Paper recycling facilities.
- Plastic recycling facilities.
- Textile recycling facilities.
- Tire recycling facilities.
- Transfer stations.
- Wood recycling facilities.
- Wood secondary processors.
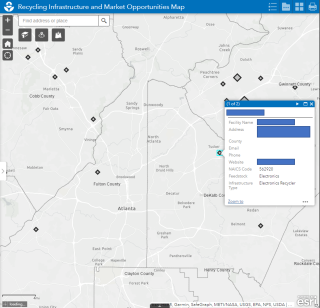
The data provide facility name, facility address, county, phone, email, website, North American Industry Classification System code, infrastructure type, and feedstock for each facility where available.
The map also includes estimated tons of generated and recycled material by ZIP code and material type. There are 16 types of recyclable material included in this version of the map:
- Aluminum.
- Cardboard.
- Electronics.
- Food Waste.
- Glass.
- High-density polyethylene Bottles #2.
- Polyethylene terephthalate Bottles #1.
- Polyethylene terephthalate Other Rigid #1.
- Polypropylene Containers #5.
- Rigid Plastics #3 to #7.
- Steel Cans.
- Tires.
- Paper.
- Textiles.
- Yard trimmings.
- Wood.
The map provides estimated U.S. recycling quantities, infrastructure, materials markets, and supporting market factors using the best available data at the time the map was developed (2021-2022). While data sources range from 2011 to 2021, most data are from 2018-2021 and are not updated in real time.
In June 2025, EPA updated the map to Version 2.0 based on the public comment period from May 12 through June 26, 2023. The updates include:
- A brand-new map user interface and layout, allowing users to more easily view the breadth of available data.
- Reduced loading time by changing the host platform to ArcGIS Online Experience Builder, a cloud-based software capable of hosting and loading large datasets.
- Consolidated web-storage location of the Recycling Map’s underlying data with additional detailed instructions for accessing and downloading these files.
Using the Map
This interactive map identifies and displays multiple layers of data on information including:
- Estimated generation, recycling, and recycling potential by ZIP code and material.
- Locations of recycling infrastructure.
- Potential primary and secondary end markets for recycled materials.
- Market factors such as landfill tipping fees and bottle bill deposit prices.
- Municipal solid waste infrastructure such as landfills and transfer stations.
The tool can be used for a variety of purposes, including:
- Assisting developers with recycling infrastructure site selection.
- Visualizing the distribution of available recycled material generated by geographic region to inform facility development and expansion sites.
- Identifying recycled material feedstocks for circular economy entrepreneurs.
- Developing or expanding hub-and-spoke collection systems to help provide economies of scale to rural recycling programs.
- Aiding local governments in designing recycling programs by estimating gaps in required recycling capacity.
Please refer to the User Guide and Technical Methodology (pdf)(1,162 KB) to learn more about the map’s full functionality and data sources.
Public Comment Period
EPA recognizes the importance of collaboration with government agencies, industries, the public, and other interested parties. The agency solicited public comments on the Recycling Infrastructure and Market Opportunities Map Version 1.0 and encouraged users to provide their feedback and recommendations. Users submitted their public comments through the Federal eRulemaking Portal using the following docket: EPA-HQ-OLEM-2022-0933. The public comment period was open for 45 days, from May 12, 2023, through June 26, 2023.
In June 2025, EPA updated the map to Version 2.0, incorporating feedback from this public comment period.
Supporting Resources
- User Guide.
- Technical Methodology (pdf)(1,162 KB).
Related Tools and Resources
- Facts and Figures about Materials, Waste, and Recycling.
- Excess Food Opportunities Map.
- Recycling Economic Information Report.
- U.S. National Recycling Goal.
- National Recycling Strategy.
- Infrastructure Investment and Jobs Act: Transforming U.S. Recycling and Waste Management.
- Model Recycling Program Toolkit.