
Electric Power Sector Emissions
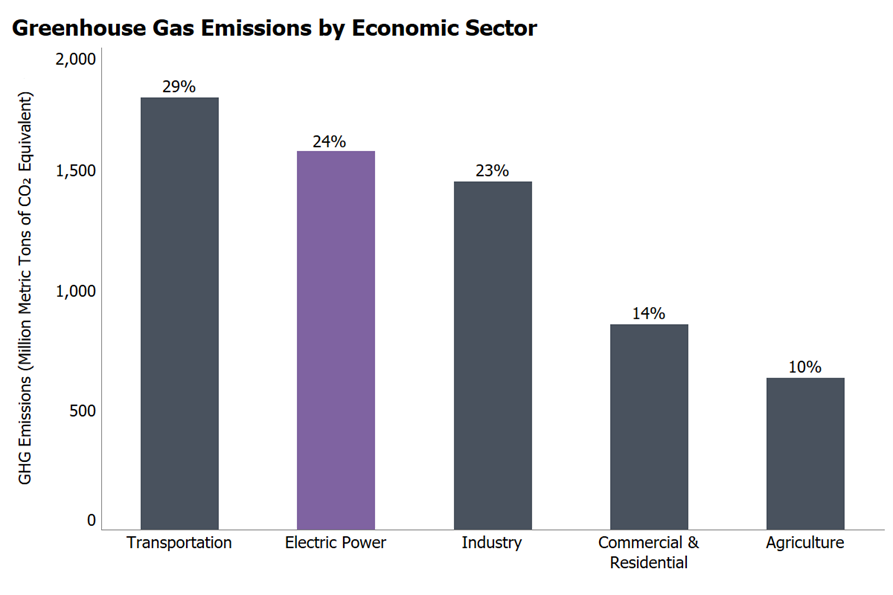
Total Emissions in 2022 = 6,343 Million Metric Tons of CO₂ equivalent. Percentages may not add up to 100% due to independent rounding. The Industry and Commercial/Residential (including buildings) sectors consume large amounts of electricity. The share of overall emissions in these end-use sectors is significantly higher when including indirect electricity-related emissions. Greenhouse gas emissions from commercial and residential buildings and industry increase substantially when emissions from electricity end-use are included, due to the relatively large share of electricity use (e.g., heating, ventilation, and air conditioning; lighting; and appliances) in these sectors. Land Use, Land-Use Change, and Forestry in the United States is a net sink and offsets 12% of these greenhouse gas emissions. This net sink is not shown in the above diagram. All emission estimates are sourced from the Inventory of U.S. Greenhouse Gas Emissions and Sinks: 1990–2022.
On this page:
- Greenhouse Gas Emissions in the Electric Power Sector by Fuel Source
- Electric Power Sector Trends
- Greenhouse Gas Emissions by Electricity End Use
- Reducing Emissions from Electric Power Production
Greenhouse Gas Emissions in the Electric Power Sector by Fuel Source
The electricity power sector involves the generation, transmission, and distribution of electricity. Carbon dioxide (CO2) makes up the vast majority of greenhouse gas emissions from the sector, but smaller amounts of methane (CH4) and nitrous oxide (N2O) are also emitted. These gases are released during the combustion of fossil fuels, such as coal, oil, and natural gas, to produce electricity. Less than 1% of greenhouse gas emissions from the sector come from sulfur hexafluoride (SF6), an insulating chemical used in electricity transmission and distribution equipment.
- Coal combustion is more carbon-intensive than burning natural gas or petroleum for electric power production. Although coal use accounted for 55% of CO2 emissions from the sector, it represented only 20% of the electricity generated in the United States in 2022.
- Natural gas use accounted for 39% of electricity generation in 2022, and petroleum use accounted for less than 1%.
- The remaining generation in 2022 came from non-fossil fuel sources, including nuclear (19%) and renewable energy sources (21%), which include hydroelectricity, biomass, wind, and solar.1 Most of these non-fossil sources, such as nuclear, hydroelectric, wind, and solar, are non-emitting.
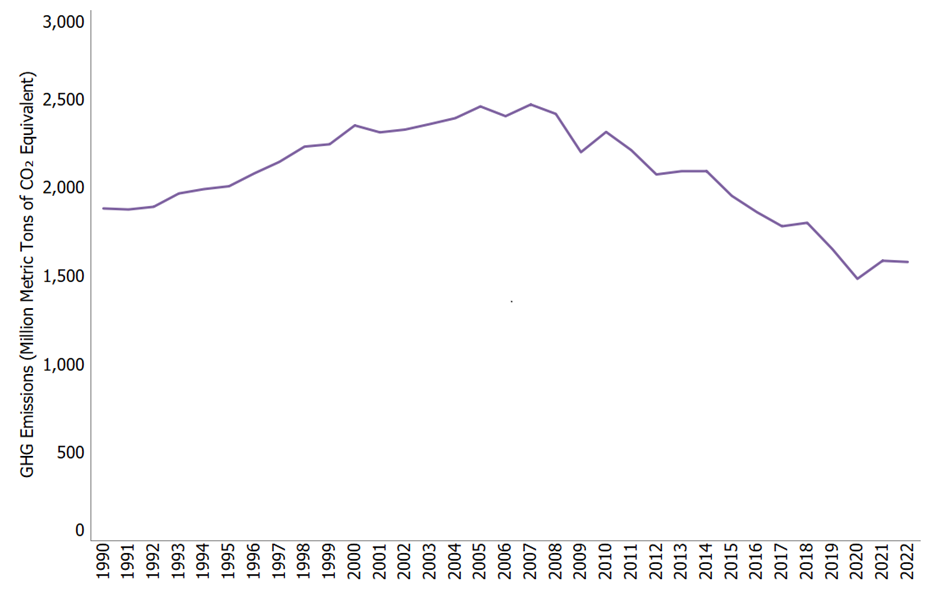
Electric Power Sector Trends
- In 2022, the electric power sector was the second largest source of U.S. greenhouse gas emissions, accounting for 25% of the U.S. total.
- Electric power sector emissions increased 7% in 2021.
- Greenhouse gas emissions from electric power production have decreased by about 15% since 1990 due to a shift in generation to lower- and non-emitting sources of electricity generation and an increase in end-use energy efficiency.
Greenhouse Gas Emissions by Electricity End-Use
Electricity is used by other end-use sectors—in homes, businesses, and factories—and the greenhouse gas emissions from electricity generation can be allocated to the sectors that use the electricity. Looking at greenhouse gas emissions by end-use sector can help us understand energy demand across sectors and changes in energy use over time.
- When emissions from electric power generation are allocated to the industrial end-use sector, industrial activities account for a much larger share of U.S. greenhouse gas emissions.
- Greenhouse gas emissions from commercial and residential buildings also increase substantially when emissions from electricity end-use are included, due to the relatively large share of electricity use mostly building related (e.g., heating, ventilation, and air conditioning; lighting; and appliances) in these sectors.
- The transportation sector currently has a relatively low percentage of electricity use and thus indirect emissions, but it is growing due to the use of electric and plug-in vehicles.
Reducing Emissions from Electric Power Production
There are a variety of opportunities to reduce greenhouse gas emissions associated with electric power production, transmission, and distribution. The table below categorizes these opportunities and provides examples. For a more comprehensive list, see Chapter 6 (pdf) of the Contribution of Working Group III to the Sixth Assessment Report of the Intergovernmental Panel on Climate Change.2
| Type | How Emissions Are Reduced | Examples |
|---|---|---|
| Increased Efficiency of Fossil-fired Power Plants and Fuel Switching | Increasing the efficiency of existing fossil fuel-fired power plants by using advanced technologies, substituting less carbon-intensive fuels, and shifting generation from higher-emitting to lower-emitting power plants. |
|
| Renewable Energy | Using renewable energy sources rather than fossil fuel to generate electricity. |
|
| Increased End-Use Energy Efficiency | Reducing electricity use and peak demand by increasing energy efficiency and conservation in homes, businesses, and industry. |
|
| Nuclear Energy | Generating electricity from nuclear energy rather than the combustion of fossil fuels. |
|
| Carbon Capture and Sequestration (CCS) | Capturing CO2 as a byproduct of fossil fuel combustion before it enters the atmosphere, transporting the CO2, injecting the CO2 deep underground at a carefully selected and suitable subsurface geologic formation where it is securely stored. Learn more about CCS. |
|
References
- U.S. Energy Information Administration (2022). Electricity Explained - Basics.
- IPCC, 2022: Climate Change 2022: Mitigation of Climate Change. Contribution of Working Group III to the Sixth Assessment Report of the Intergovernmental Panel on Climate Change [P.R. Shukla, J. Skea, R. Slade, A. Al Khourdajie, R. van Diemen, D. McCollum, M. Pathak, S. Some, P. Vyas, R. Fradera, M. Belkacemi, A. Hasija, G. Lisboa, S. Luz, J. Malley, (eds.)]. Cambridge University Press, Cambridge, UK and New York, NY, USA. doi: 10.1017/9781009157926